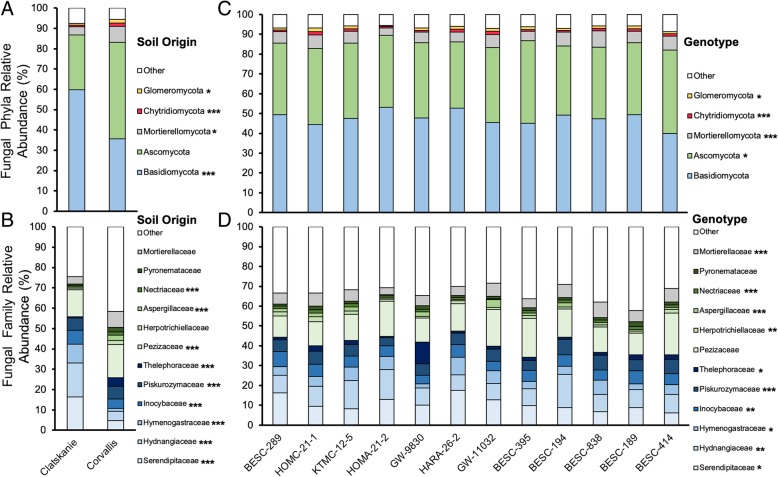
Fig. 5.
The relative abundance of dominant fungal phyla and families within soil origins (Panel a, b) and among genotypes (Panel c, d). Asterisks denote significant differences in abundance between soil origins or genotype generated by two-way ANOVA models and with an FDR-statistical correction applied. Raw counts were centered log-ratio transformed prior to ANOVA models. Due to a large portion of reads belonging to non-dominant families an “Other” category is used for clarity

