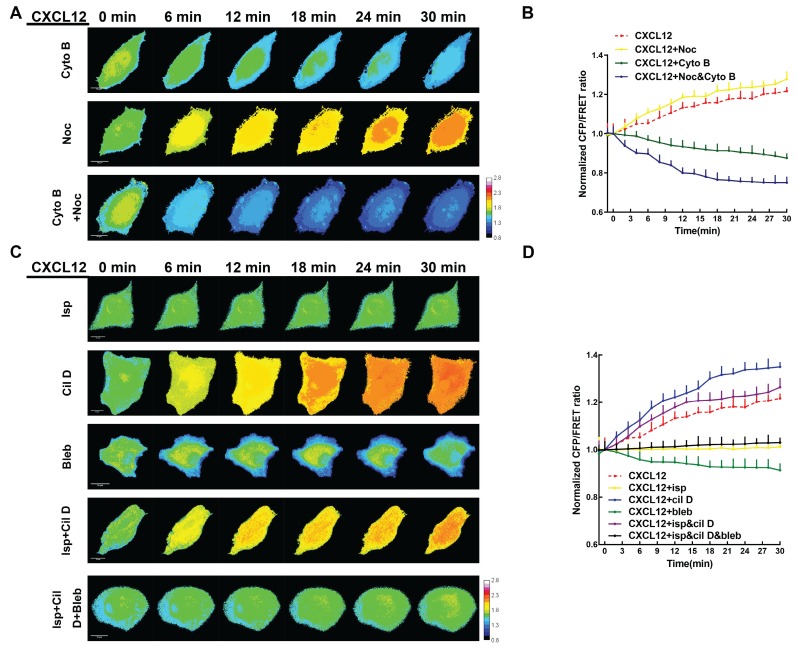
Figure 7.
MT and MF forces regulate ezrin tension sensitively during NSCLC metastasis. (A) 30-min time-lapsing images of FRET analysis in cells expressing the ezrin-M-cpstFRET probe after treating with Cyto B, Noc, and Cyto B + Noc, respectively. (C) 30-min time-lapsing images of FRET analysis in cells expressing ezrin-M-cpstFRET probe after treating with CXCL12 in combination with Cil D, Isp, Bleb, Cil D + Isp, and Cil D + Isp + Bleb, respectively. (B) and (D) Normalized signals corresponding to ezrin tension versus time under different stimuli (mean± SEM, n ≥ 5). Scale bar, 10 μm. The calibration bar: 0.8 to 2.8.

