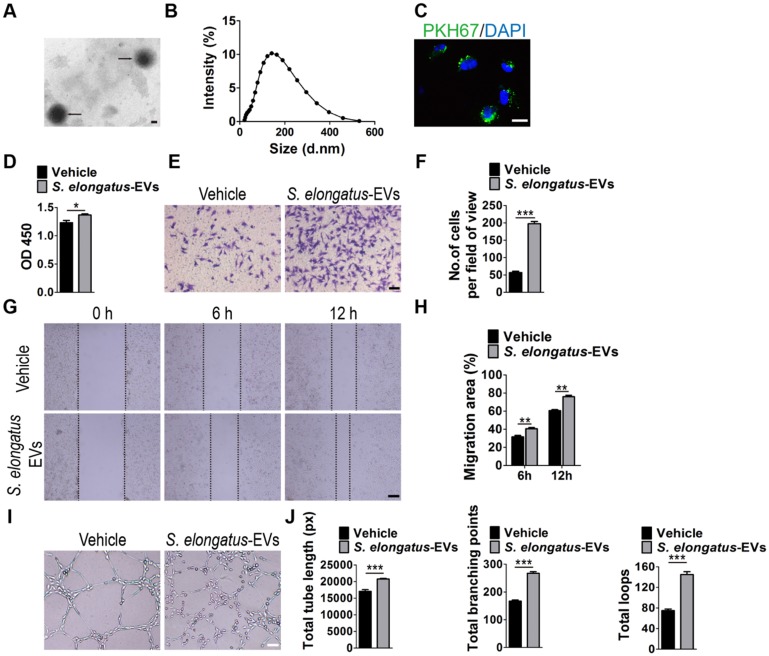
Figure 4.
S. elongatus-EVs augment the angiogenic activities of endothelial cells. (A) Morphology of S. elongatus-EVs under transmission electron microscopy. Scale bar: 50 nm. (B) Size distribution analysis of S. elongatus-EVs by dynamic light scattering. (C) Fluorescence microscopy analysis of the internalization of PKH67-labeled S. elongatus-EVs by HMECs. Scale bar: 50 μm. (D) CCK-8 analysis of HMECs' proliferation. n = 4 per group. (E-F) Representative images of transwell migration assay in HMECs (E) and quantitative analysis of the migrated cells (F). Scale bar: 100 μm. n = 3 per group. (G-H) Representative images (G) and quantification (H) of wound healing assay for HMECs. Scale bar: 200 μm. n = 3 per group. (I-J) Representative images (I) and quantification of HMECs' tube formation (J). Scale bar: 200 μm. n = 3 per group. Data are plotted as mean ± SD. *P < 0.05, **P < 0.01, ***P < 0.001.

