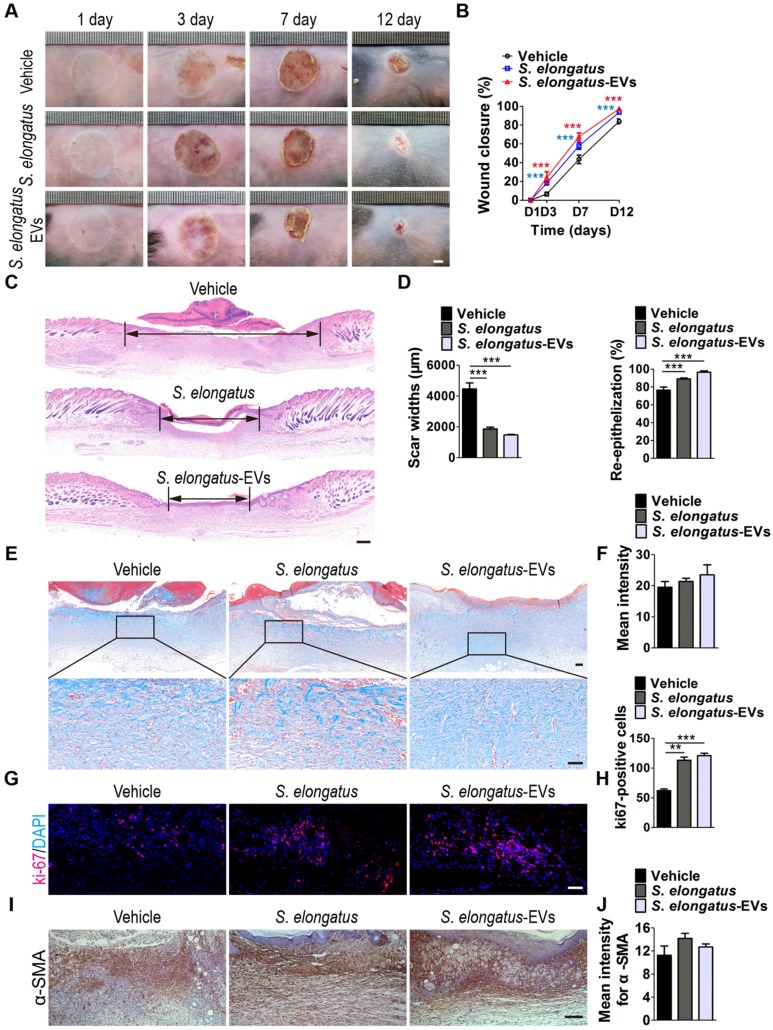
Figure 5.
S. elongatus-EVs accelerate the healing of cutaneous burn wounds. (A-B) Representative images (A) and closure rate (B) of wounds treated with PBS, S. elongatus and S. elongatus-EVs at days 3, 7 and 12 post-wounding. Scale bar: 2 mm. n = 10 per group. (C) Representative images of H&E-stained wound sections at day 12 post-wounding. Scale bar: 500 μm. (D) Quantification of the rate of re-epithelialization and scar widths. n = 3 per group. (E) Representative images of Masson's trichrome stained-wound sections at day 12 post-wounding. Scale bar: 100 μm (top) or 50 μm (bottom). (F) Quantification of the mean intensity of Masson- stained areas. n = 3 per group. (G-H) Representative images (G) and quantification (H) of skin cell proliferation by ki67 immunofluorescence staining. Scale bar: 50 μm. n = 3 per group. (I) Representative images of immunohistochemistry staining for α-SMA. Scale bar: 100 μm. (J) Quantitative analysis of the mean intensity for the α-SMA positively stained areas. n = 3 per group. Data are plotted as mean ± SD. *P < 0.05, **P < 0.01, ***P < 0.001.

