Figure 4.
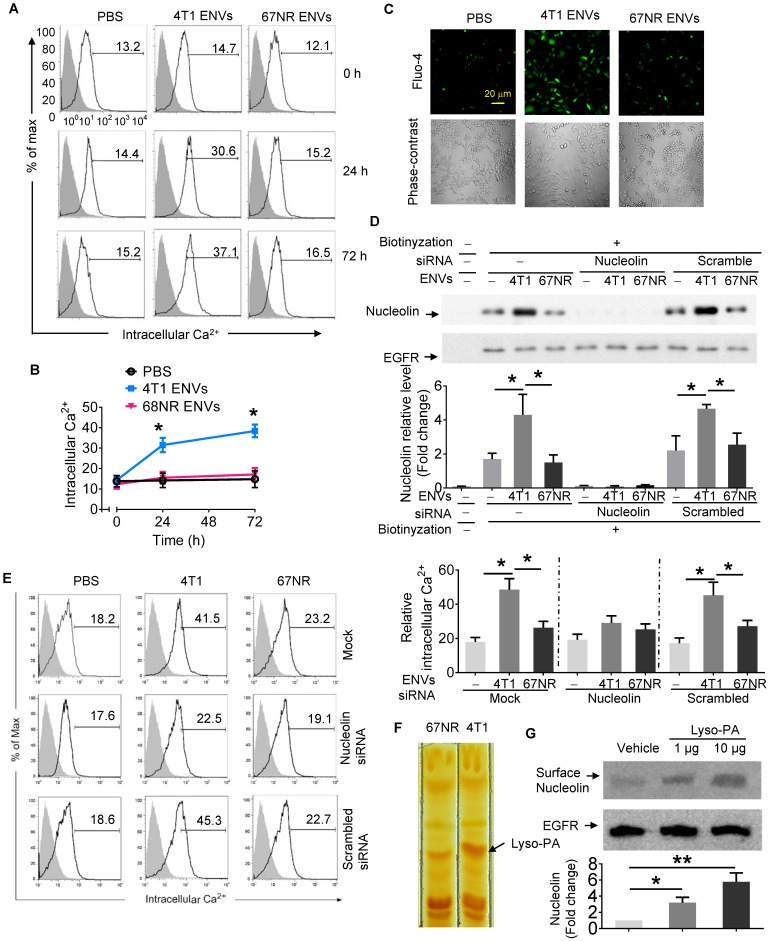
Intercellular Ca2+ fluxes induced by 4T1 ENVs are cell surface nucleolin dependent. (A) RAW264.7 cells incubated with 5 µM Fluo-4-AM treated with 4T1 ENVs or 67NR ENVs for 0 h, 24 h, and 72 h; the intracellular Ca2+ variations were visualized by Fluo-4-AM, an advanced fluorescent Ca2+ indicator using flow cytometry. (B) Quantification of results in A. 4T1 ENVs vs PBS, *p < 0.05. (C) Confocal microscopy showing variations of a typical fluorescence of intracellular Ca2+ imaging from RAW264.7 cells with fluorescent calcium indicator. (D) RAW264.7 cells were transfected with nucleolin siRNAs, control siRNAs, or incubated under the same conditions in the presence of transfection reagent for 48 h before treatment with 10 μM oligonucleotides. Then cell surface nucleolin was identified with biotinylation and Western blotting after 24 h treatment. EGFR was used as the loading control for isolated cell surface proteins (lower panels). The intensity of the cell surface nucleolin band in each sample was normalized to the corresponding EGFR band (bottom). (E) Cells were separated from the same experiment described above for analysis of intercellular Ca2+ with Fluo-4-AM by FACS. (F) TLC analysis of the lipid extracts from exosomes of 4T1 and 67NR cells. (G) RAW264.7 cells treated with lysophosphatidic acid (Lyso-PA) and vehicle as control. Analysis of nucleolin using Western blotting (top). Quantification of intensity (bottom). *P < 0.05 and **P < 0.01 (two-tailed t-test). Data are representative of three independent experiments (error bars, s.e.m.).

