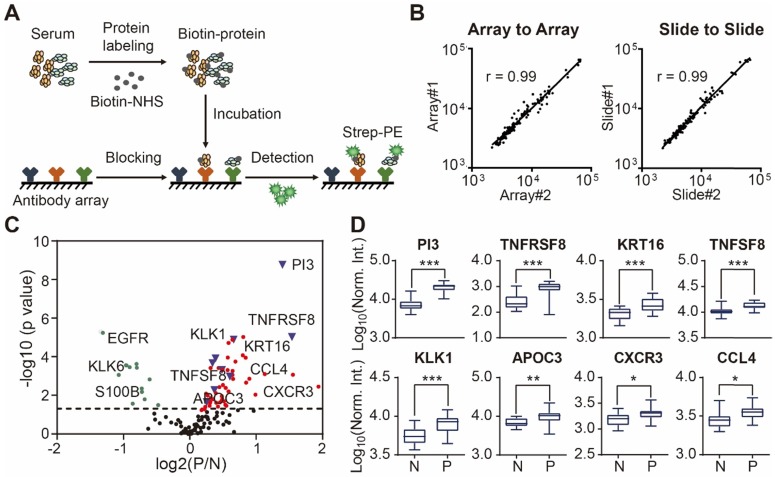
Figure 2.
Design and fabrication of psoriasis-specific antibody microarrays. (A) Workflow for antibody microarray design and fabrication; (B) Reproducibility of antibody microarray detection of serum proteins; (C) Identification of psoriasis-associated proteins in serum using volcano plot analysis. Green and red dots represent down- and up-regulated proteins that were previously shown to be associated with psoriasis, respectively. Blue dots represent the novel serum proteins associated with psoriasis disease identified in this study; (D) Box plot analysis of newly identified psoriasis-associated serum proteins. The selection of differentially expressed proteins was performed using the Satterthwaite t-test analysis (p-value = 0.05). N and P represent healthy controls and psoriatic patients, respectively. *, ** and *** represent the p-value less than 0.05, 0.005 and 0.0005, respectively.

