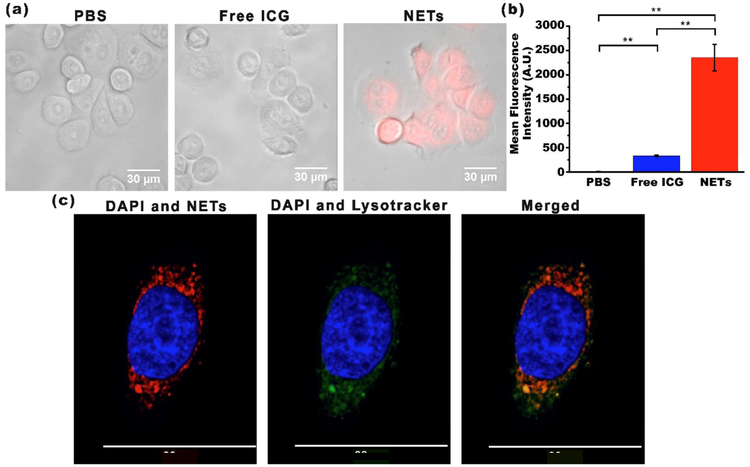
Figure 3.
Uptake of NETs by SKBR3 cancer cells. (a) Merged bright-field and fluorescent images of SKBR3 cancer cells following 3 h of incubation at 37°C with PBS, 44 μM free ICG, or NETs ([ICGNETs] ≈ 36 μM). Images are falsely colored. Red channel: NIR emission due to ICG from NETs; gray channel: bright-field. (b) Uptake analysis of SKBR3 cells by flow cytometry. Geometric mean fluorescence intensity (n = 3 different samples) **p < 0.01. (c) Laser scanning confocal fluorescent images of a SKBR3 cell following 3 h of incubation at 37°C with NETs. Images are falsely colored. Blue channel: DAPI; green channel: Lysotracker; red channel: NIR emission due to ICG from NETs.

