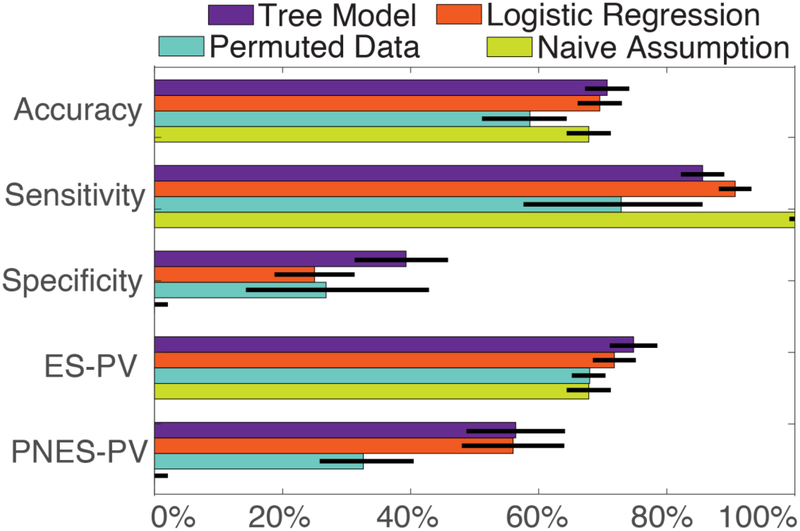
Figure 1.
Performance statistics retrospectively trained models applied to the prospective dataset. Binary summary statistics of the performance of our models are compared to either models trained on permuted datasets or that naïvely diagnose all patients with ES. The sensitivity and specificity of the naïve model is 100% and 0% by definition. Exact values for performance of all models are summarized in Supplemental Table 2. Error bars reflect standard error. Abbreviations: epileptic seizures (ES), psychogenic nonepileptic seizures (PNES), predictive value (PV).

