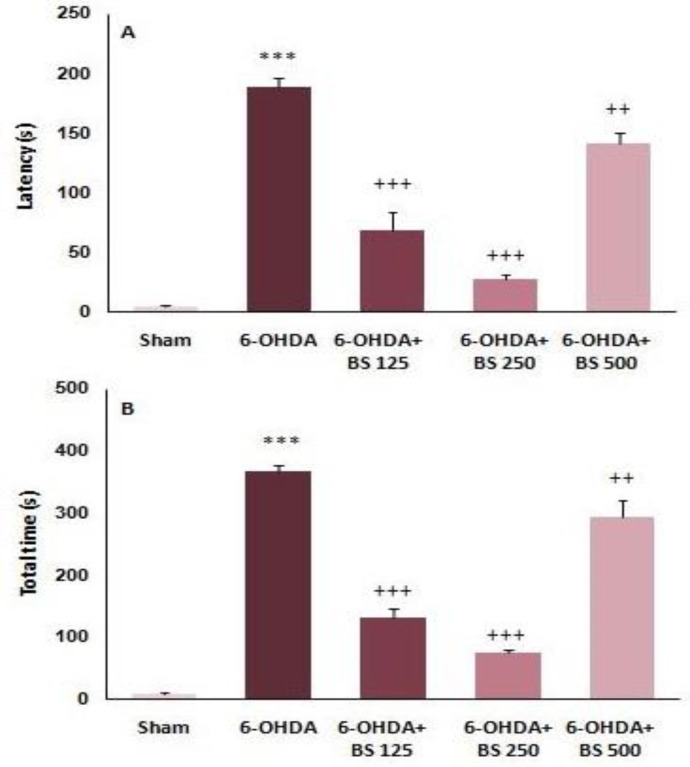
Figure 2.
The latency to initiate crossing (A) and the total time to cross the beam (B) in narrow beam test one week after intrastriatal injection of 6-OHDA to the sham, 6-OHDA and Boswellia serrata (BS)-treated groups (125, 250 and 500 mg/kg for 3 weeks). Data are presented as mean±SEM. n=6-7 in each group. ***p<0.001 shows significant difference vs sham group; ++P<0.01 and +++ p<0.001 shows significant difference vs 6-OHDA group

