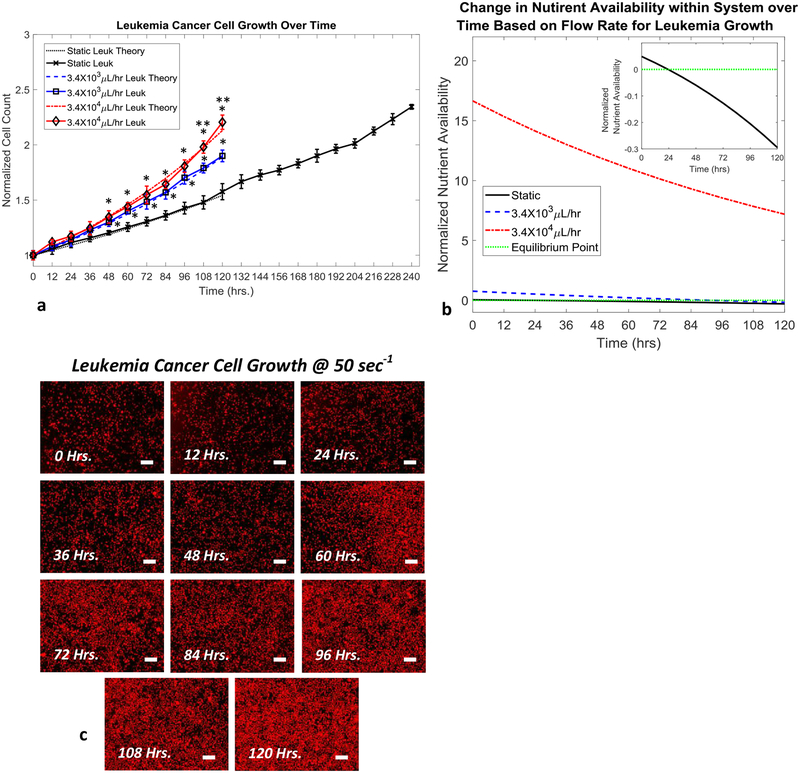
Figure 2.
Leukemia cell growth over time based on flow conditions (105 cell initial count). a, Normalized leukemia cell count over time for various flow conditions and theoretical model predictions. b, Normalized leukemia nutrient availability within microfluidic system over time for various flow conditions. Equilibrium point indicates when nutrient availability within the system can no longer satisfy the requirements of the entire cancer cell population. Inset figure shows magnified view of the static test case crossing over equilibrium point. c, Representative fluorescence images of leukemia cell growth over the course of 120 hours under a flow rate of 3.4×10⁴ μL/hr (stained with CellTracker Red™) (scale bars are 150μm). Statistical significance indicated by “*” between flow based tests and static conditions and “**” between flow based tests at p≤0.05.

