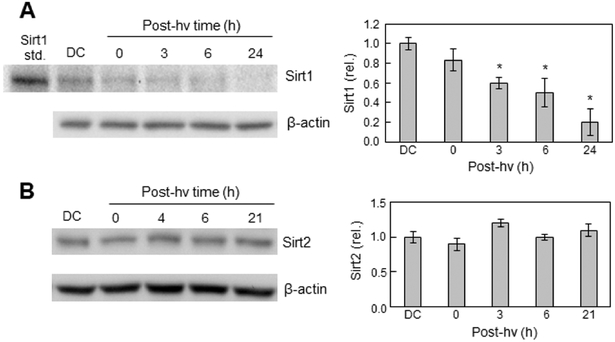
Fig. 7.
Effects of PDT on Sirt1 versus Sirt2 levels in U87 cells. U87 cells were exposed to ALA/light or ALA alone (DC) under conditions defined in Fig. 1. After the indicated post-irradiation times or 24 h for DC, samples were recovered for immunoblotting of Sirt1 (A) and Sirt2 (B). In (A), a sample of human recombinant Sirt1 was run alongside as a standard. For each analyte, a representative Western blot for an experiment run in triplicate is shown, along with a plot of band intensities relative to β-actin and normalized to DC; means ± SEM (n=3); *P<0.01 vs. DC (plot A).

