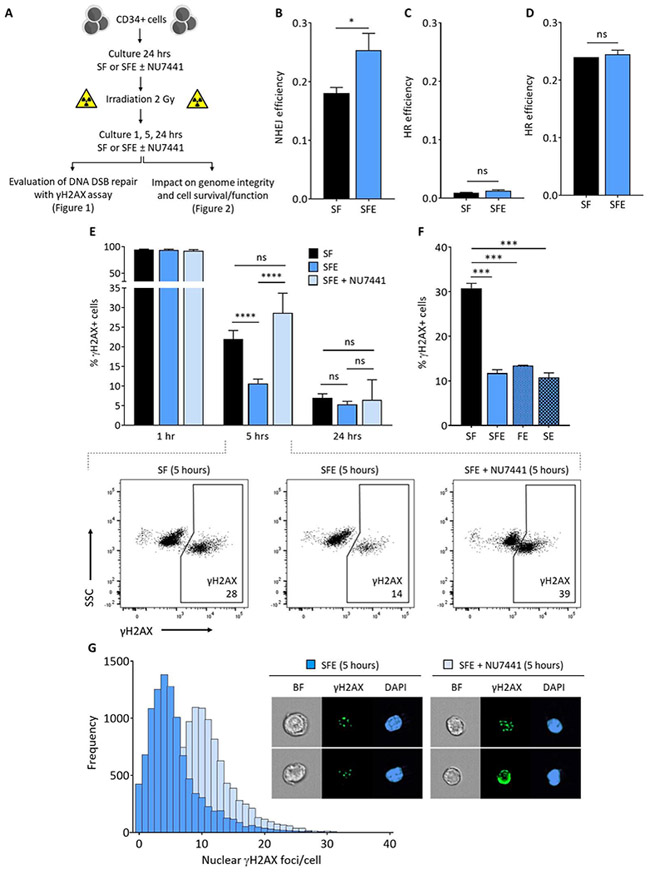
Figure 1 |. Eltrombopag promotes the C-NHEJ DNA DSB repair mechanism in human HSPCs.

(A) Experimental procedure. Human CD34+ cells were collected by apheresis of normal volunteers after G-CSF mobilization. The γH2AX assay was used to evaluate DNA DSB repair at 1, 5 and 24 hours after 2Gy IR, following a 24-hour culture in the presence of early-acting cytokines (SCF and Flt3L, designated SF), or SF supplemented with eltrombopag (SFE) with and without DNA-PK inhibitor (NU7441). Mock irradiated cells were processed and cultured following the same procedure, but not exposed to IR. Results of DNA DSB repair activity and underlying mechanisms are presented in Figure 1, and data demonstrating the impact of DSB repair on genome integrity, cell survival and function are shown in Figure 2. (B) Efficiency of NHEJ DNA repair in human HSPCs cultured with SF or SFE for 24 hours before IR and electroporation of reporter plasmids (n=3). (C) Efficiency of HR DNA repair in human HSPCs cultured for 96 hours to enhance cell cycling before IR and electroporation of reporter plasmids (n=3). (D) Efficiency of HR DNA repair in actively cycling c-MPL expressing HEL 92.1.7 cells cultured for 96 hours before IR and electroporation of reporter plasmids (n=3). (E) Summary of H2AX phosphorylation (γH2AX) at 1, 5 and 24 hours after 2Gy IR of human HSPCs cultured with SF, SFE or SFE + NU7441 (n=24, from 13 independent donors). Insets show representative γH2AX immunostaining flow cytometry plots indicating that addition of the DNA-PK inhibitor NU7441 during culture completely abrogated the enhanced kinetics of DNA DSB repair observed at 5 hours with eltrombopag in HSPCs compared with the SF control group (bottom). The flow cytometry gating strategy is shown in Figure S3A. (F) Summary percentages of γH2AX+ cells at 5 hours post-IR of human HSPCs cultured in SF, SFE, FE (Flt3L and eltrombopag but no SCF), or SE (SCF and eltrombopag but no Flt3L) (n=3). (G) Frequencies of nuclear γH2AX foci detected per cell at 5 hours post-IR using multispectral imaging flow cytometry in human HSPCs cultured with SFE in the presence or absence of NU7441. A representative of 3 experiments is shown. Insets show bright field (BF) images, γH2AX foci and DAPI nuclear staining of representative cells. In panels (B) to (F), results are displayed as mean ± SEM; * signifies p<0.05, *** p<0.001, **** p<0.0001, and ns-not significant, by unpaired Student’s t-tests.
