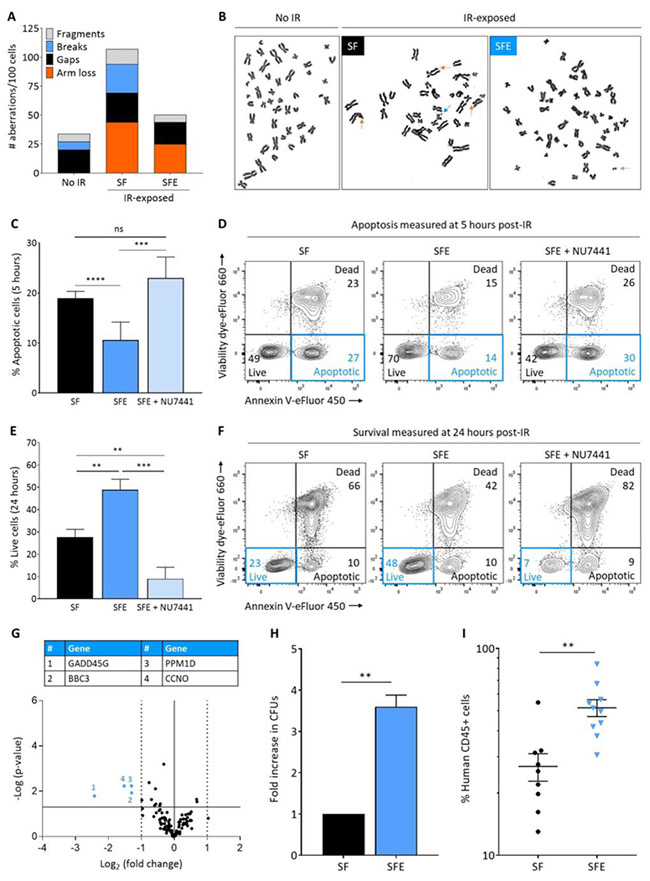
Figure 2 |. Eltrombopag-mediated DNA DSB repair results in enhanced genome stability, survival and function of human HSPCs.

(A) Quantification of chromosomal aberrations on metaphase spreads of human CD34+ cells cultured as described in Figure 1A with SF or SFE prior to 2Gy IR. No IR control CD34+ cells were subjected to the same culture conditions with SFE, but not exposed to IR. Chromosomal aberrations observed in the no IR group result from the prolonged ex vivo cultures required for karyotyping analyses. (B) Representative metaphase spreads of human CD34+ cells showing chromosomal aberrations marked with arrows. Color of each arrow refers to a specific aberration, as defined in legend of Figure 2A. (C) Summary of percentages of apoptotic cells at 5 hours post-IR of human HSPCs cultured with SF, SFE or SFE + NU7441 (n=15, from 11 independent donors). (D) Representative cell viability flow cytometry plots obtained by dual annexin V/viability dye immunostaining at 5 hours post-IR of human HSPCs cultured with SF, SFE or SFE + NU7441. (E) Summary of percentages of live cells at 24 hours post-IR of human HSPCs cultured with SF, SFE or SFE + NU7441 (n=15, from 11 independent donors). (F) Representative cell viability flow cytometry plots obtained by dual annexin V/viability dye immunostaining at 24 hours post-IR of human HSPCs cultured with SF, SFE or SFE + NU7441. The flow cytometry gating strategy is shown in Figure S3B. (G) Volcano plot showing gene expression data at 5 hours post-IR of human HSPCs cultured with SFE compared with SF (n=3). The X and Y axes show gene expression fold-change of SFE vs SF and statistical significance, respectively. Each point represents an individual gene. The solid horizontal line shows where p = 0.05; points above the line have p < 05 and points below the line have p > 0.05. The solid vertical line shows where fold-change = 1 and the dashed vertical lines show where fold-change is > 2-fold. The colored numbered points indicate genes-of-interest that display both > 2-fold changes in expression and high statistical significance. All results were normalized based on GAPDH expression. (H) Fold increase in colony forming units (CFUs) counted 10-14 days affter plating human HSPCs cultured and irradiated as previously described; data were normalized to the SF control group. (I) Human cell engrafftment as measured by human CD45-expressing cells in the bone marrow of immunodeficient recipient (NSG) mice 12 weeks after transplantation of human HSPCs cultured and irradiated as previously described. Each dot represents an individual mouse (n = 19 mice). In panels (C), (E), (H) and (I), results are displayed as mean ± SEM; ** signifies p<0.01, *** p<0.001, **** p<0.0001, and ns-not significant, by unpaired Student’s t-tests.
