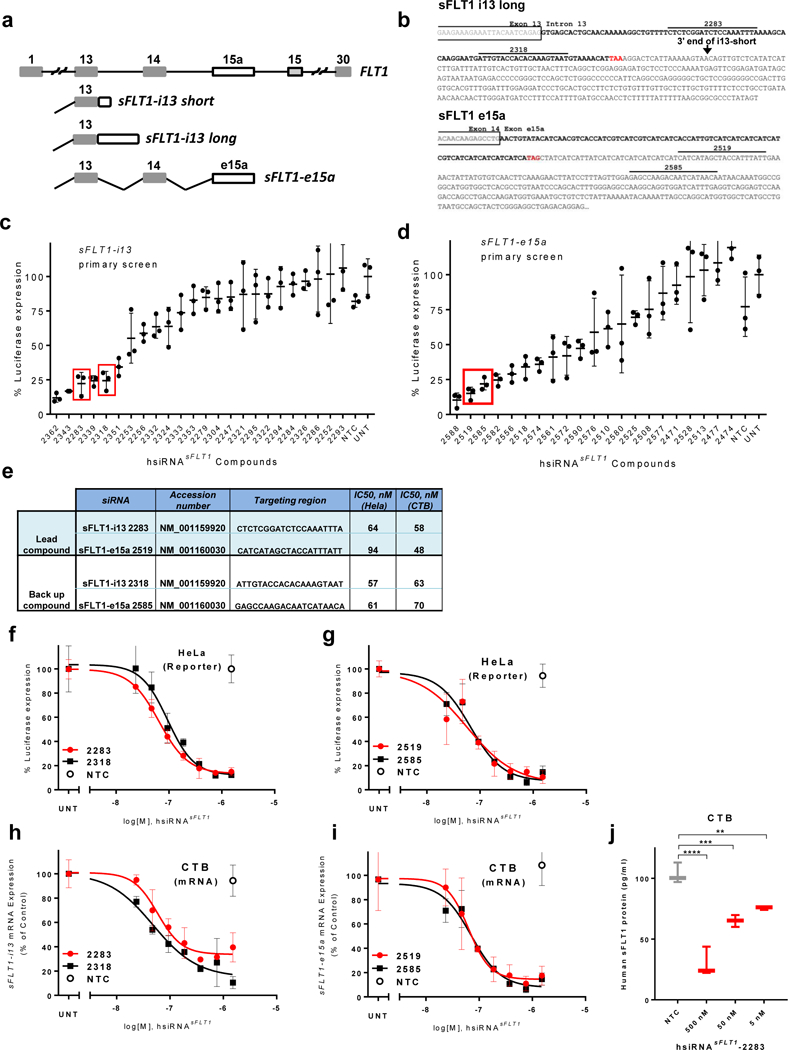
Figure 1. Development of hydrophobically modified, chemically stabilized hsiRNA compounds against sFLT1.

a. Schematic representation of exon-intron structure of sFLT1-i13 and sFLT1-e15a mRNAs. b. sFLT1-i13 and sFLT1-e15a unique sequence regions. Locations of lead siRNA target sites are indicated. Stop codons are shown in red. c-d. Results of screen for hsiRNAs (1.5 μM) that silence sFLT1-i13 and sFLT1-e15a using luciferase-based reporters in HeLa cells. siRNA numbers correspond to the 5’ position of the siRNA target site in the mRNA. UNT, untreated control, NTC, non-targeting control. (n=3, mean ± SD). Solid bars indicate lead compounds selected for further evaluation. e. siRNAs targeting sFLT1-i13 and sFLT1-e15a. f-g. Dose-response curves of lead hsiRNAsFLT1 silencing of sFLT1-i13 and sFLT1-e15a luciferase reporters in HeLa cells. h-i. Dose-response curves of lead hsiRNAsFLT1 silencing of sFLT1-i13 and sFLT1-e15a mRNAs in cytotrophoblast (CTB) cells. (n=3, mean ± SD). j. sFlt1 protein levels produced by CTB cells treated with hsiRNAsFLT1-2283 or hsiRNANTC. Level of sFlt1 protein was measured by ELISA (n=2, mean ± SD) (**P<0.01, *P,<0.05, ns - not significant, one-way ANOVA).
