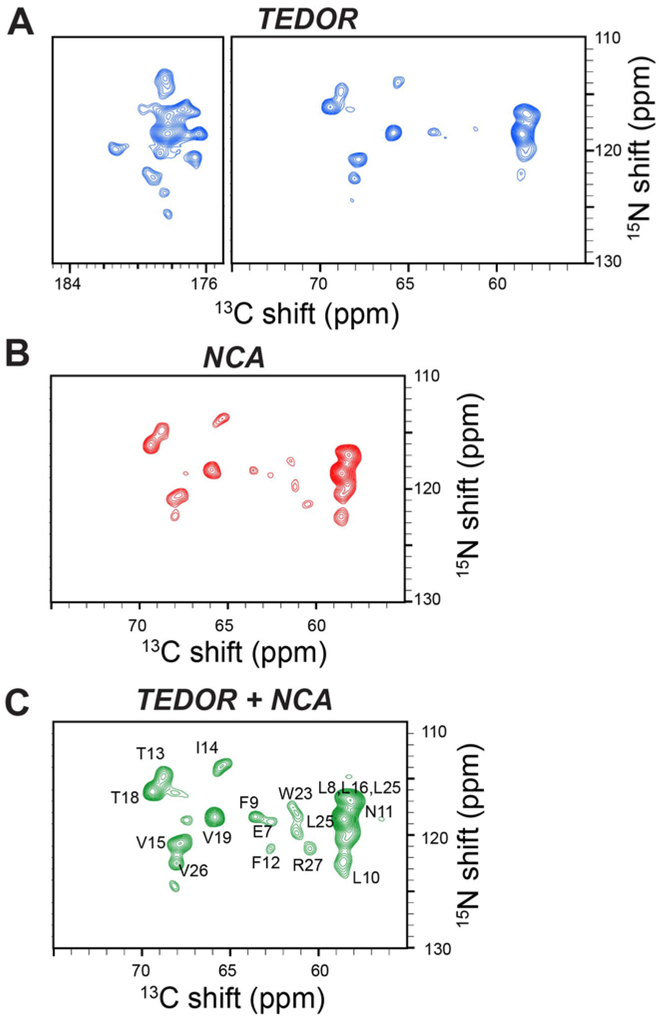
Figure 3:
A. 2D TEDOR spectrum of SLN (blue); B. 2D NCA spectrum of SLN (red). Both A and B were acquired simultaneously using the TEDOR-NCA pulse sequence. C. Sum of the TEDOR and NCA spectra. The resonances in the spectrum have an average sensitivity enhancement of 32% for 13Cα region. All the spectra were plotted at same noise level.

