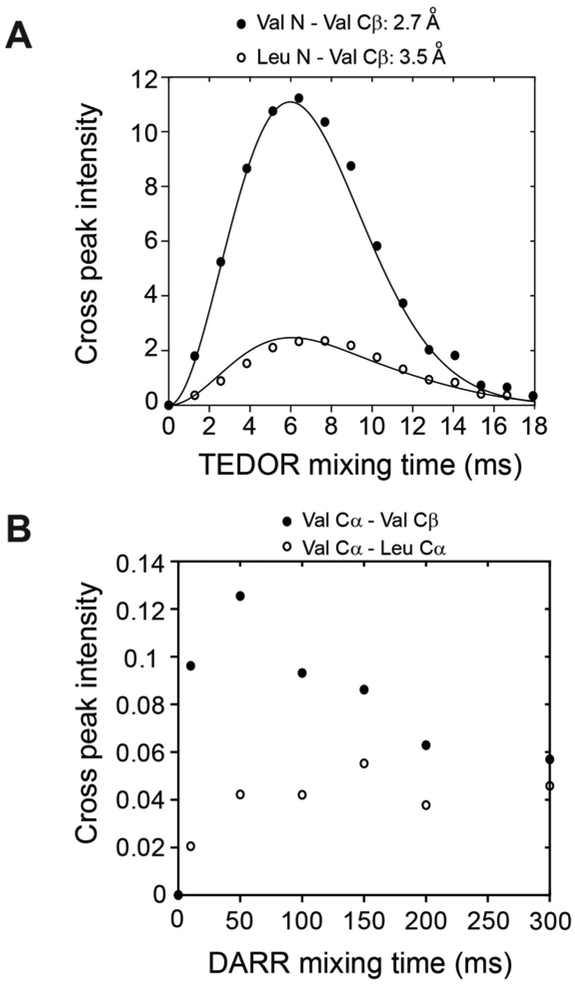
Figure 8:
Simultaneous measurement of 15N-13C and 13C-13C distance restraints on NAVL dipeptide from 3D-TEDOR-NCACX-NCOCX spectra of Figure 7. A. 3D TEDOR cross peak intensities as a function of the mixing time. The Val N to Val Cβ cross peaks are indicated as filled circles. The cross peaks for Leu N to Val Cβ are indicated with open circles. The cross peak intensities were fit with simulated curves using 2.7 and 3.5 Å, respectively. B. NCACX cross peak intensities between Val Cα-Cβ and Val Cα–Leu Cα plotted at different DARR mixing times.

