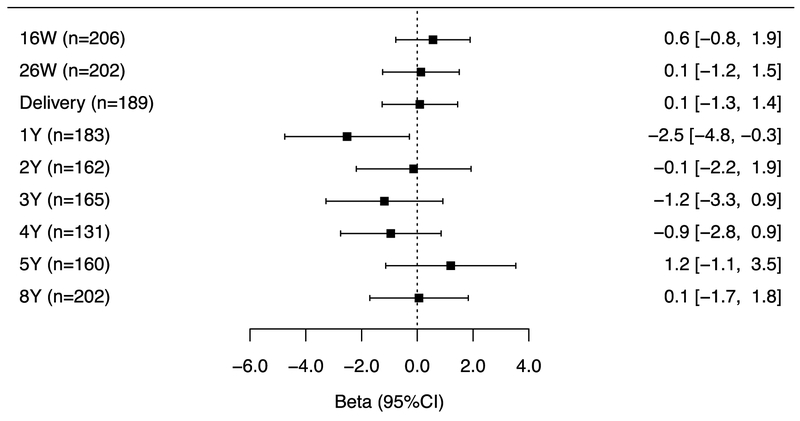
Figure 4C.
Adjusted differences in child internalizing scores at age 8-years per 10-fold increase in gestational and childhood triclosan concentrations.
Abbreviations: BSI= behavioral symptoms index, BASC-2= Behavioral Assessment for Children-2, BDIII= Beck Depression Inventory-II, ADHD= attention deficit-hyperactivity disorder.
Multiple informant regression models of (creatinine-standardized-log10-transformed) urinary triclosan concentration and BASC-2 composite linear regression models adjusted for log10-transformed serum cotinine concentrations (continuous), child sex (male vs. female), child race/ethnicity (White-non-Hispanic, Black-non, Hispanic, and other), household income (continuous), marital status (married vs. unmarried), maternal education (less than high school, high school graduate, and some college or greater), caregiving environment scores (continuous), BDI-II (continuous), and ADHD (continuous). Error bars are 95% Confidence Intervals.
Urinary triclosan x exposure period interaction p-value= 0.06, 0.06, and 0.28, respectively.

