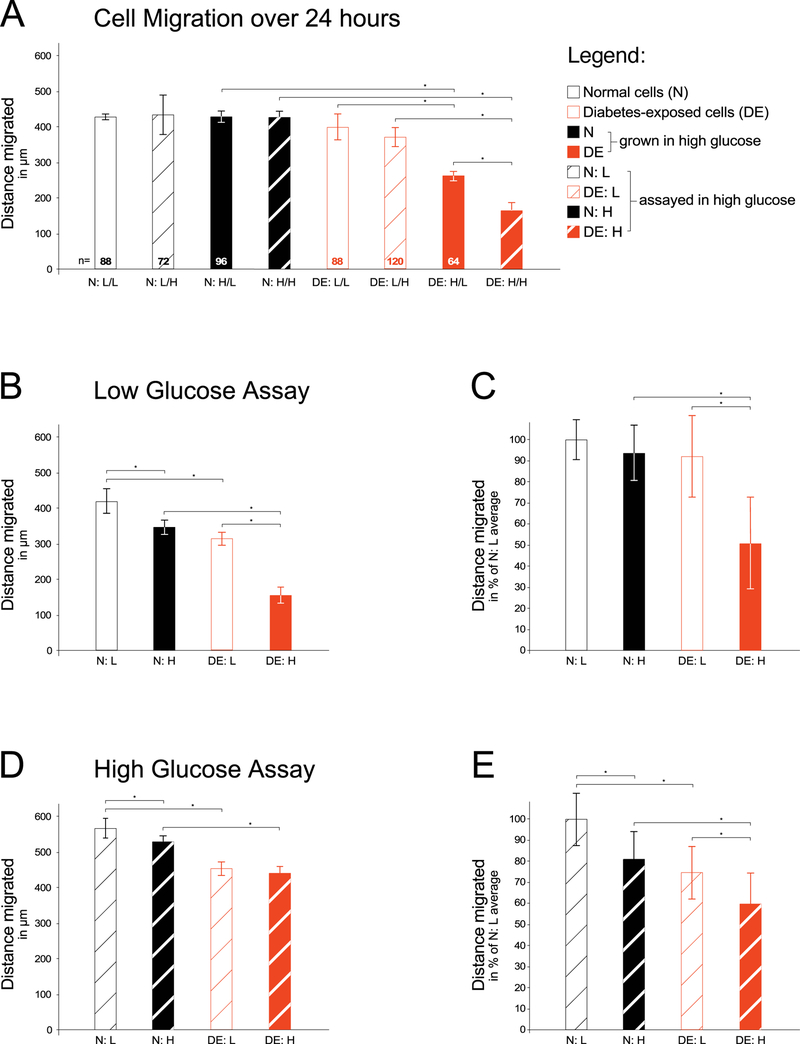
Figure 2. Assay for migratory capacity of primary embryonic fibroblasts exposed to maternal diabetes in vivo.
Primary cells were isolated from embryos of either normal (N) pregnancies or diabetic (DE) pregnancies as described in the Methods section. For each migration assay, isolates were thawed and grown for 2–3 passages before the assay in either low (L) glucose conditions or high (H) glucose-containing media. Migration assays were performed in either media condition as indicated. Panel A: A scratch was made through the confluent cell layer, and time-lapse images were taken of cells migrating into the scratch over the next 24 hours (number of wells/condition = 3, number of cells measured/condition is given at the bottom of each bar). Cells that came from diabetes-exposed embryos migrated shorter distances, particularly after having been maintained in high glucose conditions. Panel B: Individual experiment with all four conditions assayed on the same 24-well plate. For condition N:L migration distance was measured for a total of 125 individual cells (25 cells in one well and 20 cells in each of 5 wells); for N:H 130 individual cells were measured (17, 19, 35, 19, 20, and 20 cells/well); for condition D:L 133 individual cells were measured (19, 21, 20, 20, 30, and 23 cells/well); and for condition D:H 79 individual cells were measured from 4 wells (19, 26, 18, and 19 cells/well). Panel C: Aggregate results from four independent experiments, in which the average of condition N:L was normalized to 100%, and individual well averages were transformed to percentage values relative to the 100% for each experiment, respectively. Condition N:L was represented by a total of 21 wells, and migration distance was measured for a total of 642 individual cells; for condition N:H 670 individual cells were measured; for condition D:L 762 individual cells were measured; and for condition D:H 350 individual cells were measured from 15 wells. The averages were calculated over all wells for a given condition (21, 21, 21, and 15 wells/condition, respectively). Panel D: Individual experiment with 6 wells/condition, migration assayed in high glucose-containing media. For condition N:L migration distance was measured for a total of 168 individual cells, from 36, 31, 38, 18, 24, and 21 cells/well, respectively; for N:H 190 individual cells were measured (37, 40, 35, 25, 24, and 29 cells/well); for condition D:L 180 individual cells were measured (34, 40, 41, 24, 22, and 19 cells/well); and for condition D:H 113 individual cells were measured (24, 26, 11, 18, 16, and 18 cells/well). Panel E: Aggregate results from four independent experiments, normalized as described for Panel C. Condition N:L was represented by a total of 21 wells, and migration distance was measured for a total of 275 individual cells; for condition N:H 356 individual cells were measured; for condition D:L 386 individual cells were measured; and for condition D:H 179 individual cells were measured from 13 wells. The average was calculated over all wells for a given condition (21, 21, 21, and 13 wells/condition, respectively). Significantly (P<0.05) reduced cell migratory capacity (indicated by asterisks) was observed in cells with prior exposure to maternal diabetes in vivo, particularly when these cells were maintained in high glucose-containing media.

