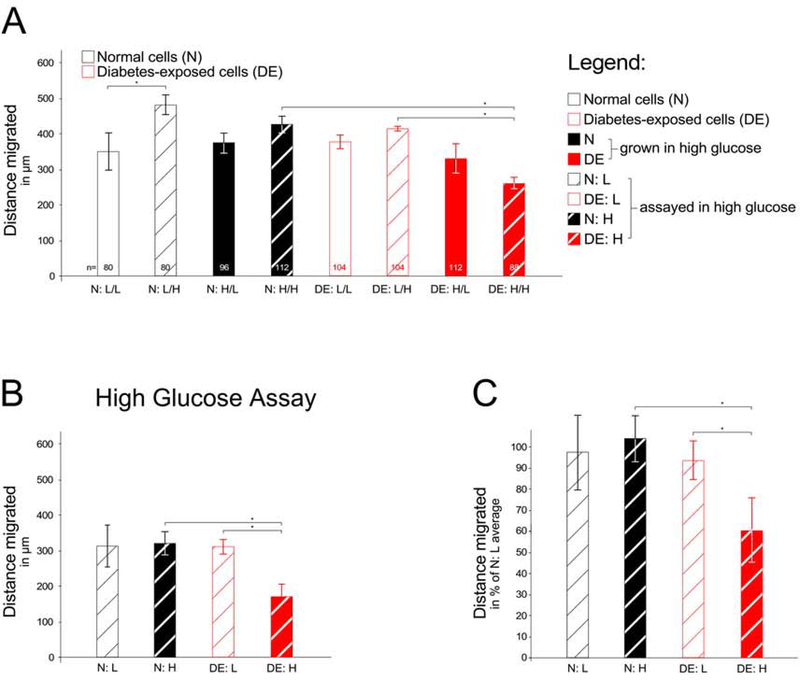
Figure 3. Migratory capacity of additional independent primary embryonic cell lines.
Cell migration was measured as described in the Legend to Figure 2. Panel A: Assay over the 24 hours (number of wells/condition = 3). Panel B: Individual experiment with all four conditions on the same 24-well plate, assayed in high glucose-containing media. For condition N:L migration distance was measured for a total of 200 individual cells (40, 32, 24, 24, 40, and 40 cells/well); for N:H 216 individual cells were measured (32, 16, 48, 32, 48, and 40 cells/well); for condition D:L 240 individual cells were measured (56, 32, 40, 40, 40, and 32 cells/well); and for condition D:H 174 individual cells were measured from 4 wells (47, 47, 40, and 40 cells/well). Panel C: Aggregate results from four independent experiments. Over all four experiments, condition N:L was represented by a total of 18 wells, and migration distance was measured for a total of 553 individual cells; for condition N:H 679 individual cells were measured (18 wells); for condition D:L 669 individual cells were measured (18 wells); and for condition D:H 566 individual cells were measured from 15 wells. Cells with prior exposure to maternal diabetes in vivo exhibited significantly (P<0.05) reduced cell migratory capacity when these cells were maintained in high glucose-containing media.

