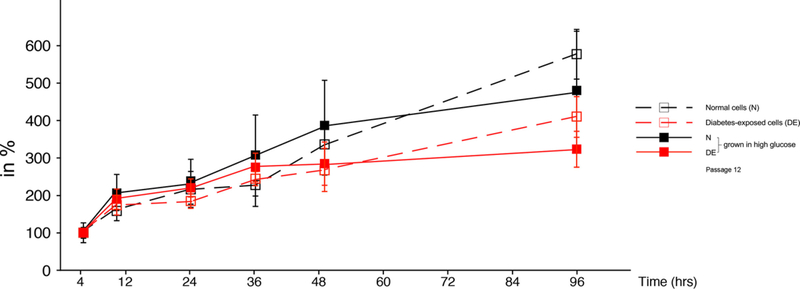
Figure 4. Cell counting of primary embryonic cells in culture.
The same cell lines as used in Figure 3 were assayed for cell number (for experimental details see Methods section), and were maintained and assayed (triplicate wells/condition and time point) in low glucose conditions (open symbols, hatched lines), or high glucose conditions (closed symbols, solid lines). Significant differences (P<0.05) were only found between normal and diabetes-exposed cells in each condition at 96 hours.

