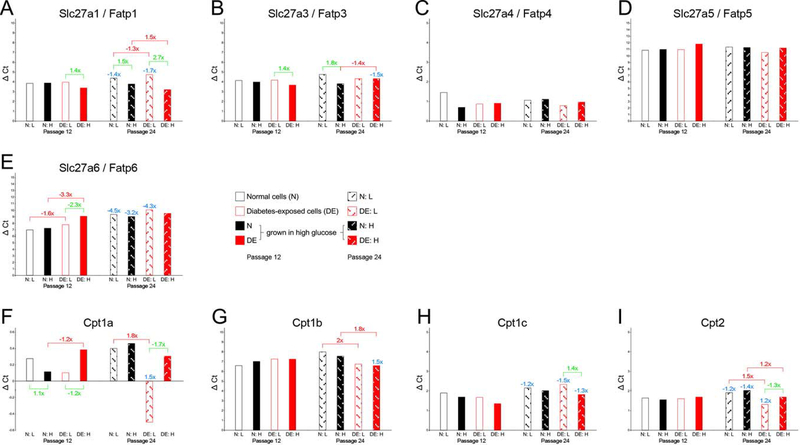
Figure 7. Expression of nutrient transporters as assayed by quantitative real-time PCR: fatty acid transporters.
Expression levels are expressed in ΔCycle threshold (Ct) values, relative to the references gene averages (see Methods for details), with each sample measured in triplicate on the same assay plate. Standard deviations for the technical replicates are not depicted because they were negligible. Higher bars (larger ΔCt values) correspond to lower expression levels, smaller ΔCt values (lower bars) reflect higher expression levels. Fold-changes are given for significant differences in expression level when compared for the same condition between passage 12 and passage 24 (blue numbers), for comparisons of the same cell line in different maintenance media conditions (green numbers), and for differences between normal and diabetes-exposed cells (red numbers). Note that Y-axes have different scales for different genes.

