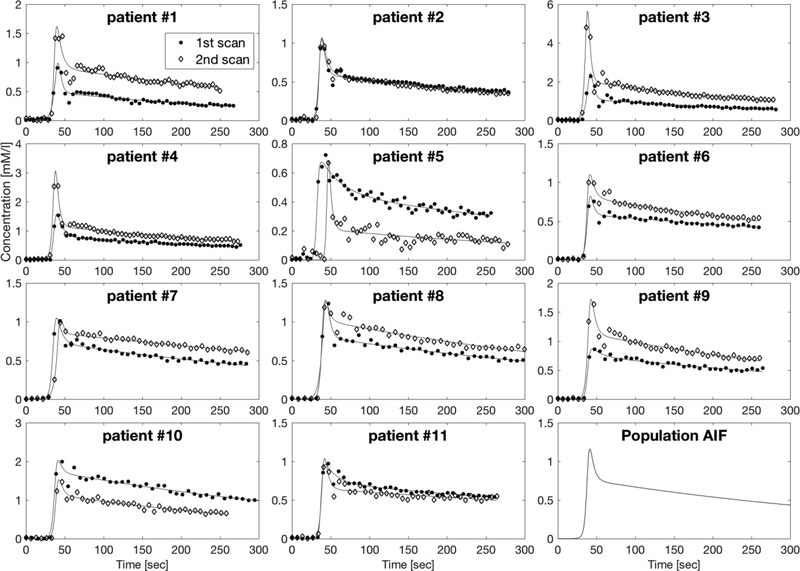
Figure 3.
AIFs calculated after measurement from the mean of left and right artery ROIs in all 22 DCE scans (11 patients x 2 scans) with fits to biexponential x sigmoid functions (see text). The concentration units of the vertical axis are mM/liter and the horizontal axis is Time [sec]. The population AIF resulting from taking the median values of the parameters fitted to Eq. [5] (sigmoid × biexponential) from all 22 scans, is shown in the bottom right plot.

