. 2019 Apr 30;28(2):247–260. doi: 10.5607/en.2019.28.2.247

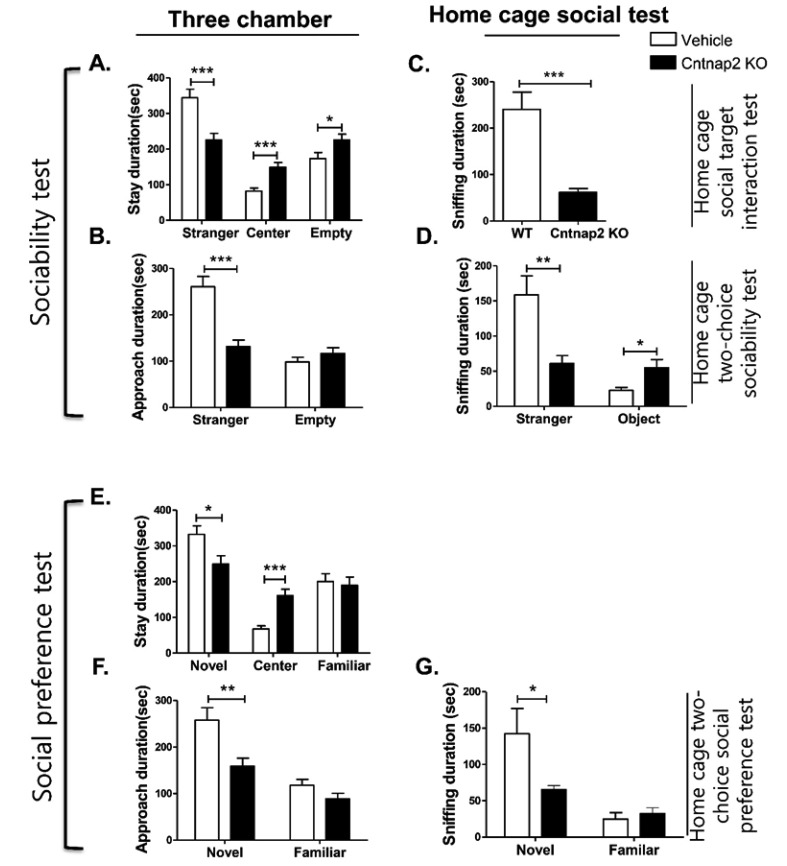
Fig. 6. Sociability and social preference determined by the time spent in each compartment and approach duration of Cntnap2 knockout mice in the three-chamber assay and home cage social test. This figure shows the time spent (duration) in each compartment (A) and approach duration (B) of Cntnap2 knockout mice compared to controls in the three-chamber social test; the time spent (duration) sniffing by Cntnap2 knockout mice compared to controls in the home cage social target interaction test (C); the home cage two-choice sociability test (D); social preference test (E~G); the time spent (duration) in each compartment (E) and approach duration (F) of Cntnap2 knockout mice compared to control in the three-chamber social test. The time spent (duration) for sniffing by Cntnap2 knockout mice compared to controls in the home cage two-choice social preference test (G). The number of animals per condition is as follows: Cntnap2 KO and WT in three-chamber social test, n=12; Cntnap2 KO and WT in the home cage social target interaction test, n=8 and n=9, respectively; Cntnap2 KO and WT in the home cage two-choice sociability and social preference test, n=11 and n=12. respectively. All data are expressed as the mean±SEM. *p<0.05, **p<0.01, ***p<0.001, WT, wild-type group mice; Cntnap2 KO, Cntnap2 knockout mice.

Fig. 6