. 2019 Apr 30;28(2):183–215. doi: 10.5607/en.2019.28.2.183

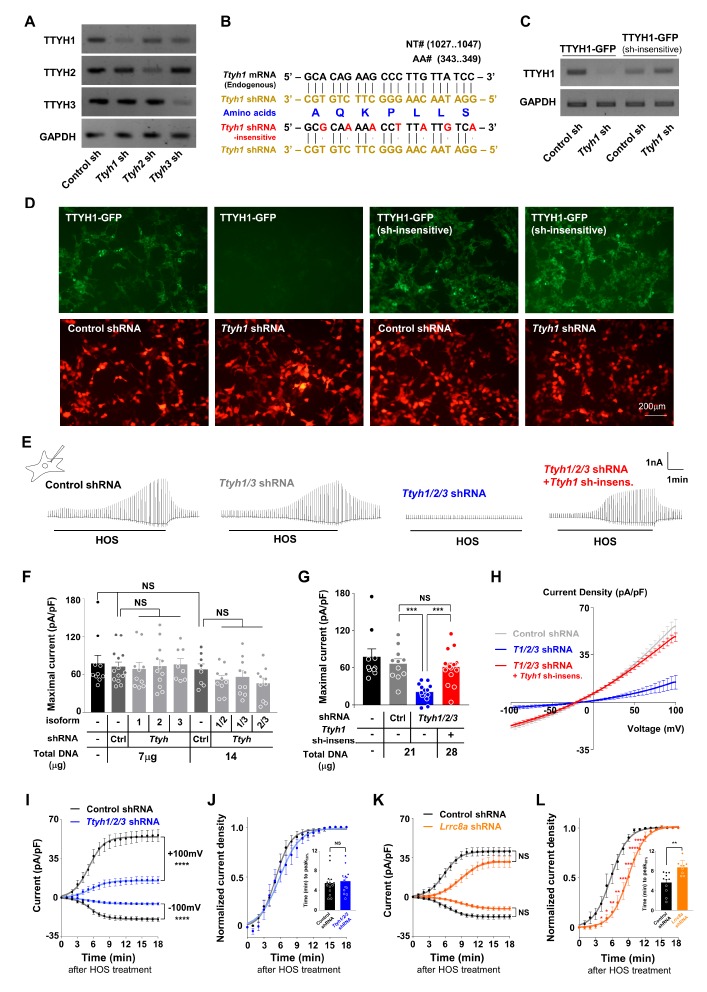
Fig. 2. Ttyh family of genes encode the essential components of the astrocytic VRACswell. (A) RT-PCR results confirming the efficiency of each Ttyh1/2/3 shRNA in cultured astrocytes. Lentivirus containing each pSicoR Ttyh1/2/3 shRNA were infected in cultured astrocytes. (B) Schematic diagram of the design of shRNA-insensitive clone of TTYH1. The upper sequence represents endogenous Ttyh1 mRNA sequence that is complemented with Ttyh1 shRNA. The lower sequence represents shRNA-insensitive clone of TTYH1 sequence that is not complemented with Ttyh1 shRNA due to changing every third single nucleotide of Ttyh1 shRNA target site to another nucleotide that makes same amino acid due to the codon redundancy. (C) RT-PCR results confirming the efficiency for shRNA-insensitivity using shRNA-insensitive clone of TTYH1 with control or Ttyh1 shRNA compared to TTYH1-GFP with control or Ttyh1 shRNA overexpressing HEK293T cells. (D) Fluorescence images of TTYH1-GFP and shRNA-insensitive clone of TTYH1 with control or Ttyh1 shRNA expressing HEK-293T cells. (E) Representative ICl,swell from control shRNA, Ttyh1/3 shRNAs, Ttyh1/2/3 shRNAs, Ttyh1/2/3 shRNAs with shRNA-insensitive clone of TTYH1 (Ttyh1 sh-insens.) expressing cultured astrocytes. (F) Summary bar graph showing the maximal amplitude of ICl,swell from +100 mV to −100 mV in the presence of single Ttyh shRNA or any combination of double Ttyh shRNAs (T1, T2, T3, T1/2, T1/3, T2/3 shRNAs). Data are represented as mean±SEM (n=10 for Naïve, n=14 for 7mg of control shRNA, n=10, 12 and 8 for 7mg of single Ttyh1, Ttyh2, and Ttyh3 shRNA, n=8 for 14mg of control shRNA, n= 10, 10 and 10 for 14mg of double Ttyh1/2, Ttyh1/3, and Ttyh2/3 shRNAs; NS>0.05, Kruskal-Wallis test). (G) Summary bar graph showing the maximal amplitude of ICl,swell from +100 mV to −100 mV in naïve astrocytes and in the presence of control or Ttyh1/2/3 shRNAs and Ttyh1/2/3 shRNAs with shRNA-insensitive clone of TTYH1 expressing cultured astrocytes. Data are represented as mean±SEM (n=10 for Naïve, n=11 for control shRNA, n=13 for Ttyh1/2/3 shRNAs, and n=18 for Ttyh1/2/3 shRNAs with shRNA-insensitive clone of TTYH1; ***<0.001, NS>0.05, Ordinary one-way ANOVA). (H) Averaged I~V curves for ICl,swell in Control shRNA (grey), Ttyh1/2/3 shRNAs (T1/2/3 shRNAs, blue) and T1/2/3 shRNAs with shRNA-insensitive clone of TTYH1 (Ttyh1 sh-insens; red). (I, K) Averaged current density values at ±100mV in every minute after HOS treatment in control (black), Ttyh1/2/3 shRNAs (blue) and Lrrc8a (orange) expressing cultured astrocytes. Dot points are represented as mean±SEM. Lines (dark grey, sky blue, and orange) between each value were drawn by the fitting of sigmoidal 4th order function. (n=11 for both control shRNA (grey), n=13 for Ttyh1/2/3 shRNA (sky blue), and n=9 for Lrrc8a shRNA (orange)). (J, L) Normalized current density from +100 mV to −100 mV by maximum current amplitude in every minute after HOS treatment. Dot points are represented as mean±SEM. Lines (dark grey, sky blue, and orange) between each value were drawn by the fitting of sigmoidal 4th order function. (n=11 for both control shRNA (grey), n=13 for Ttyh1/2/3 shRNA (blue), and n=9 for Lrrc8a shRNA(orange)). Inset: The averaged time to 50% of peak. Data are represented as mean±SEM (n=11 for both control shRNAs, n=13 for Ttyh1/2/3 shRNA, and n=9 for Lrrc8a shRNA).

Fig. 2