. 2019 Apr 30;28(2):183–215. doi: 10.5607/en.2019.28.2.183

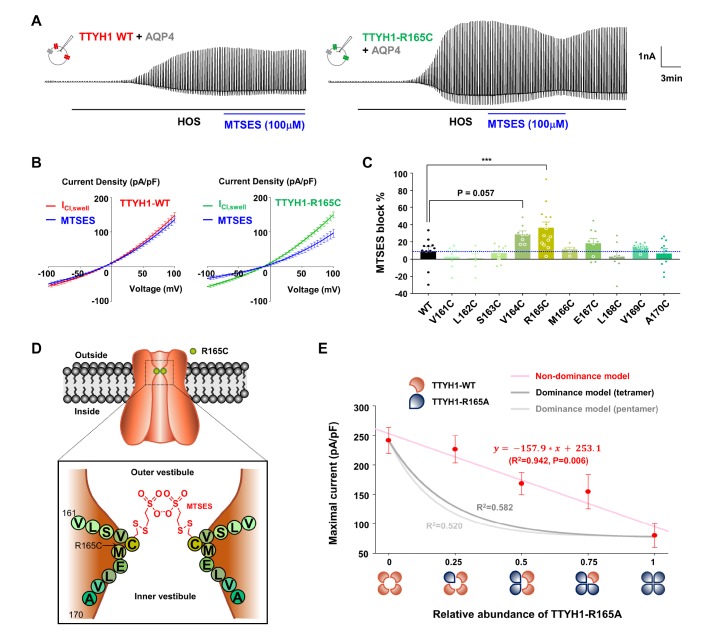
Fig. 9. R165 in TTYH1 is the pore-forming amino acid as evidenced by SCAM. (A) Representative traces of ICl,swell recording from TTYH1-WT and TTYH1-R165C with AQP4 co-expressing HEK293T cells during treatment HOS (black bar) in the presence or absence of MTSES (100 mM, blue bar). Left upper insets represent TTYH1-WT (red) and TTYH1-R165C (green) with AQP4 (grey) co-expressing HEK293T cells. (B) Averaged I~V curves for ICl,swell recording from TTYH1-WT and TTYH1-R165C with AQP4 co-expressing HEK293T cells in the absence of MTSES (red and green, respectively) or presence of MTSES (100 mM, blue). (C) Summary bar graph showing the MTSES block percentage (%) recorded from TTYH1-V161C to TTYH1-A170C compared to TTYH1-WT with AQP4 co-expressing HEK293T cells. Data are represented as mean±SEM (n=11 for TTYH1-WT with AQP4 co-expressing HEK293T cells, n=8, 7, 10, 8, 14, 5, 9, 8, 8, and 10 for from TTYH1-V161C to TTYH1-A170C with AQP4 co-expressing HEK293T cells; ***<0.001, Ordinary one-way ANOVA). (D) Schematic diagram of pore-forming subunit of TTYH1 predicted by results from mutagenesis-based structure-activity analysis and SCAM experiment. (E) Summary graph showing the maximal current of ICl,swell (red, n=12, 10, 16, 9 and 11, respectively) according to the relative abundance of TTYH1-R165A, fitted with linear-regression (pink line, R2=0.942, p=0.006). The non-dominance model for tetramer and pentamer is indicated with dark-grey and grey lines (R2 between the experimental results and the dominance model of tetramer and pentamer were 0.582 and 0.520, respectively).

Fig. 9