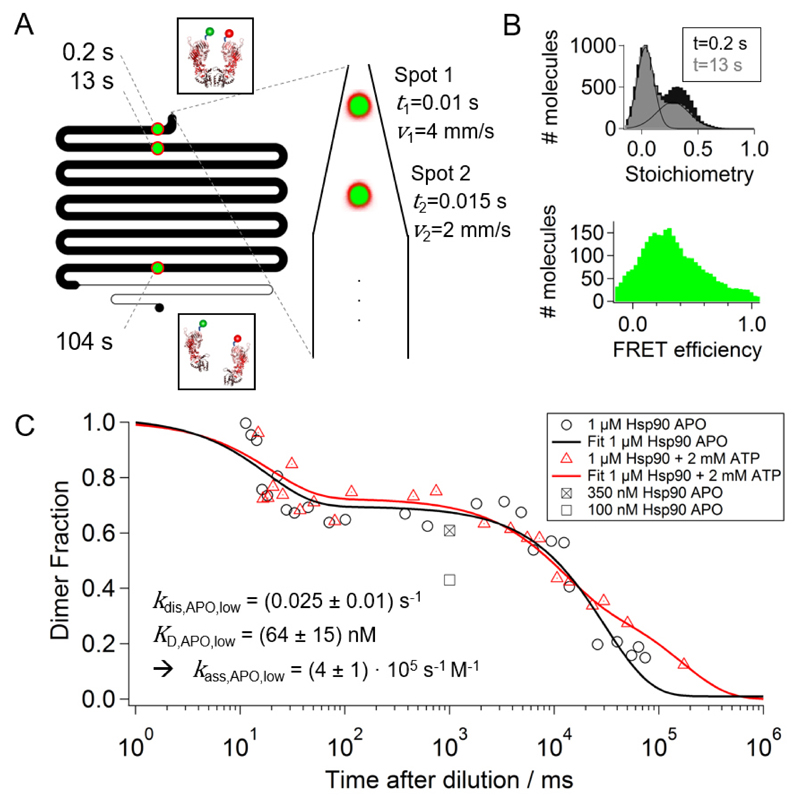
Figure 2.
Dissociation of the Hsp90 dimer. (A) The confocal laser foci are placed at different positions in the measurement chamber representing different times after dilution. The design of the measurement channel allows us to measure dissociation rates between 5 ms 100 s (B) Stoichiometry histograms are shown for two different measurement positions, i.e. dilution times. The corrected dimer fraction at each time point is calculated from the acceptor-only (S < 0.2) and the FRET population (0.2 < S < 0.8) using equation (14). A FRET efficiency histogram is shown for a time point of 1 s after dilution indicating that Hsp90 is mainly populated in an N-terminally open conformation. (C) The corrected dimer fractions for two measurement series, namely 1 μM Hsp90 APO (black circles) and 1 μM Hsp90 + 2mM ATP (red triangles), are plotted on a logarithmic timescale. The data is fitted with two- or three-exponential decays. Optimal fits result in two dissociation rates for Hsp90 APO, kdis,APO,high=52 s-1 with amplitude AAPO,high=32 % and kdis,APO,low=0.025 s-1 with AAPO,low=68 %, and three dissociation rates for Hsp90+ATP, kdis,ATP,high=51 s-1 with AATP,high=28 %, kdis,ATP,mid=0.09 s-1 with AATP,mid=36 %, and kdis,ATP,low=0.006 s-1 with AATP,low=36 %. The square marks represent average dimer fractions for different Hsp90 APO concentrations in the incubation chamber. This enables determination of the equilibrium dissociation constant KD and the association rate kass. The uncertainties are the standard deviation of three separate measurements.

