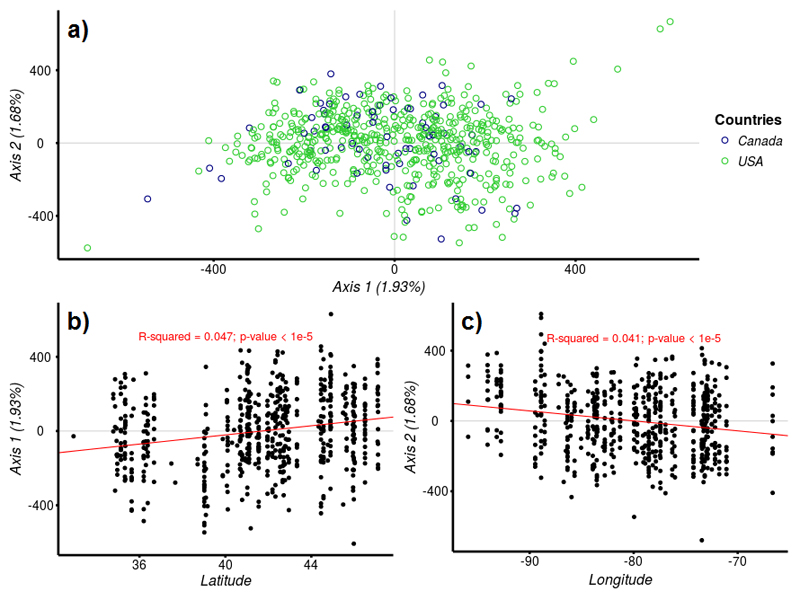
Fig. 2.
a) Correspondence Analysis (CA) of all North American individuals. Green open circles represent individuals from USA and blue open circles represent individuals from Canada. b) Linear regression between projections on the first axis (Axis1) of the Correspondence Analysis (CA) for all North American individuals and latitude of each population origin. c) Linear regression between the projections on the second axis (Axis 2) of CA for all North American individuals and longitude of each population origin.

