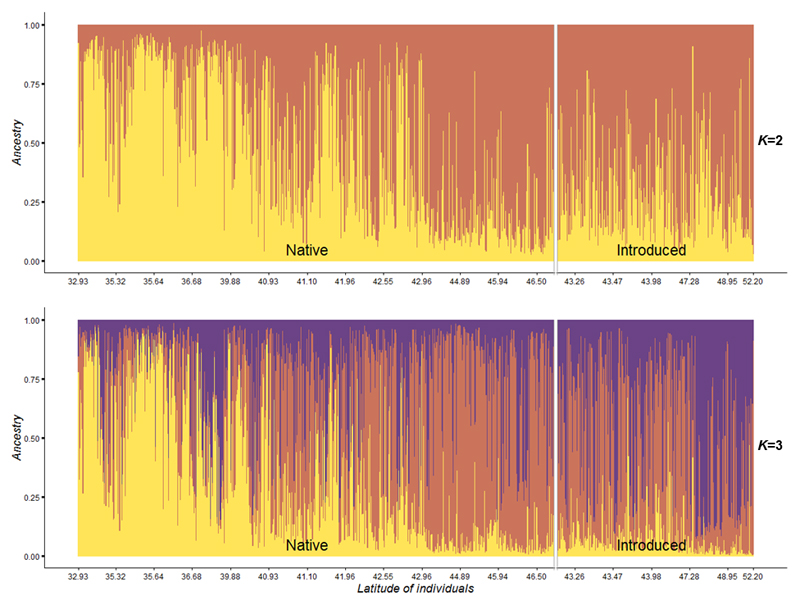
Fig. 6.
Posterior estimates of cluster membership for native and introduced individuals (respectively n=624 and n=259) at K=2 and K=3, obtained with TESS software. Genetic cluster of G1 is represented in orange, G2 in yellow and G3 in purple. Individuals are arranged according to their latitudinal coordinates from South to North (from left to right).

