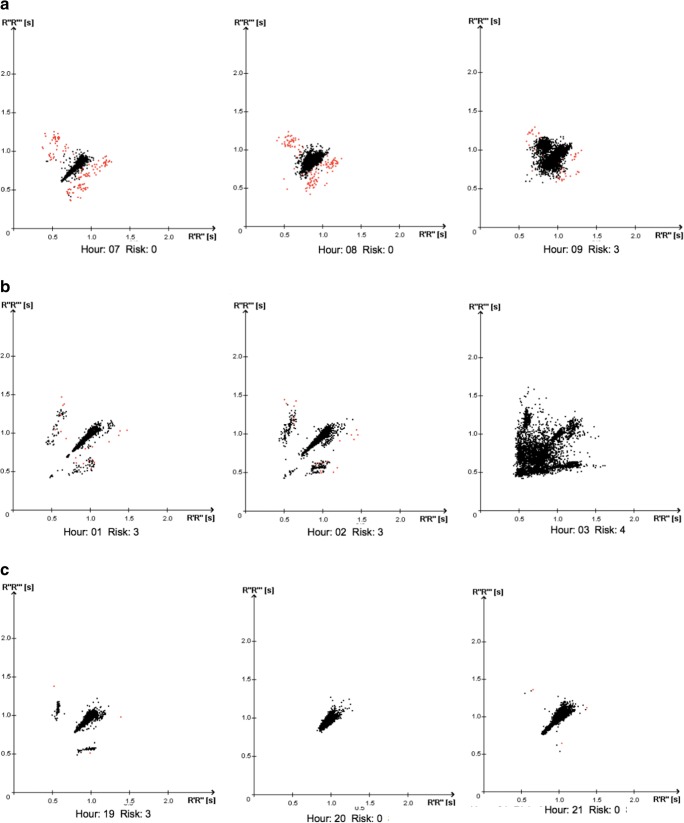
Fig. 1.
Examples of RR interval variability during continuous cardiac monitoring. Each plot represents 1 h of monitoring (the Lorentz plots: each RR interval is plotted as a function of the preceding RR interval). a Transitioning from low to high AF risk. b Transitioning from high risk to manifest AF. c Transitioning from high risk to low risk. AF atrial fibrillation, s seconds, Risk SRA clinic risk grade for atrial fibrillation. 0 = low risk; 3 = high risk; 4 = manifest AF (see the “Methods” section)

