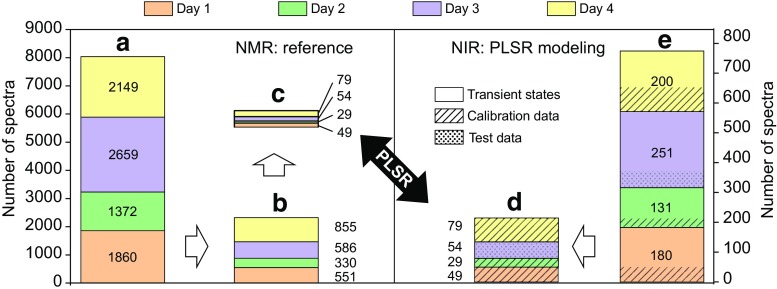
Fig. 5.
Visualization of the data selection prior to PLSR modeling. A total of 8040 NMR and 762 NIR spectra were recorded during four runs at the pilot plant on four different days (a, e). NMR spectra measured during steady concentration states (b) were extracted. Due to shorter measurement intervals, more NMR spectra than NIR spectra were available. By a nearest-neighbor approach, the corresponding NMR and NIR spectra during steady states were matched (c, d). Based on the two data sets (c) and (d), PLSR models were developed. NIR data acquired during steady states (d) were therefore split into a calibration and a test set. The remaining NIR spectra during transient states were used as an additional test set

