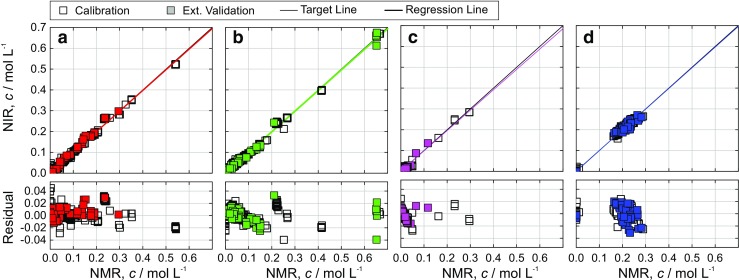
Fig. 6.

Calibration results of NIR data within the continuous production of 2-nitrodiphenylamine (NDPA). The parity plots show the predicted concentration values versus the online reference method (43-MHz proton NMR spectra). The test data set yielded RMSE values of 10, 12, 7, and 14 mmol L−1, respectively, for aniline (a), o-FNB (a), Li-aniline (c), and the product Li-NDPA (d), cf. Table 2
