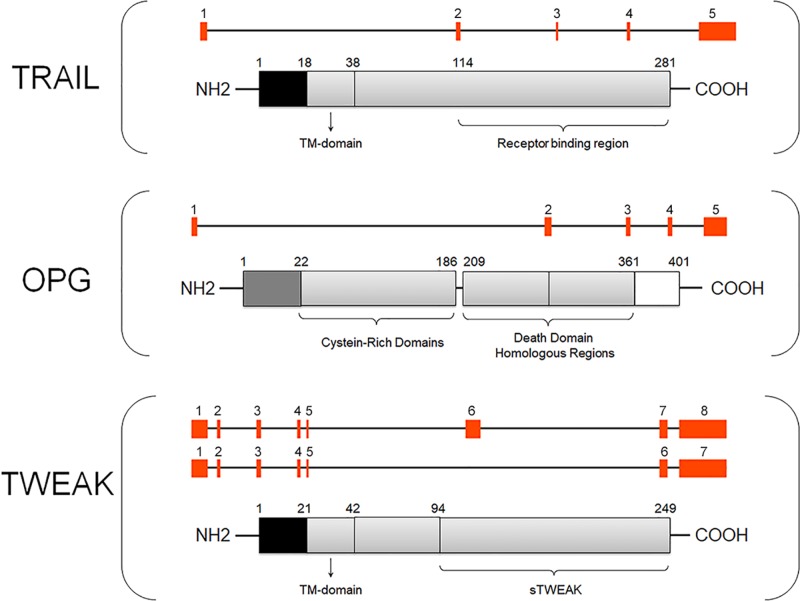
Figure 1. Graphical structure of TRAIL/OPG/TWEAK genes and proteins.
The picture shows a schematic representation of TRAIL/OPG/TWEAK genes (GENATLAS) where exons are indicated by red squares. For TWEAK, a transcript variant representing a shorter transcript encoding the functional protein is also shown. Each gene is shown with the respective schematic protein reporting the main relevant structural domains. Note: figures not drown to scale. Abbreviation: TM, transmembrane.

