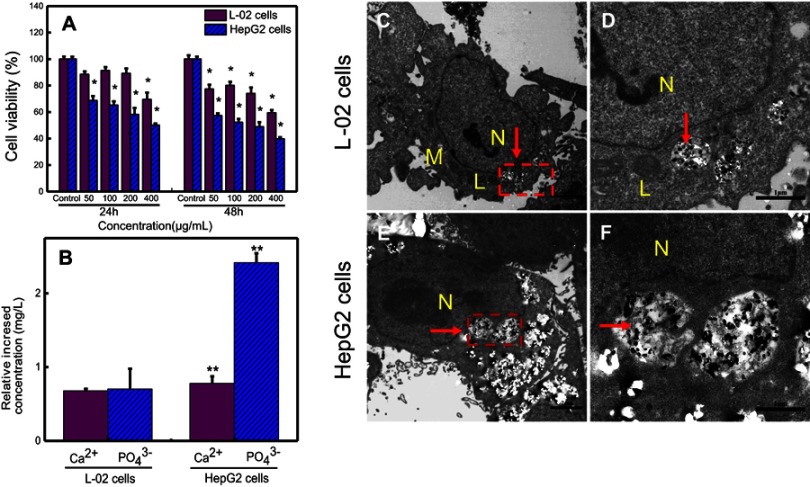
Figure 3.
(A) Comparison of the cell viabilities of HepG2 and L-02 cells treated with different concentrations of nano-β-TCP for 24 and 48 hours. (B) The relative increased intracellular content of Ca2+ and PO43- ions in L-02 and HepG2 cells treated with nano-β-TCP (400 μg/mL) for 48 hours (vs control group, *P<0.05, **P<0.01). TEM images of L-02 (C, D) and HepG2 (E, F) cultured with nano-β-TCP (400 μg/mL) for 48 h. (D and F are enlarged views of C and E in red pane, respectively).
Abbreviations: N, nucleus; M, mitochondria; L, lysosomes; the particles labelled by red arrows are nano-β-TCP.

