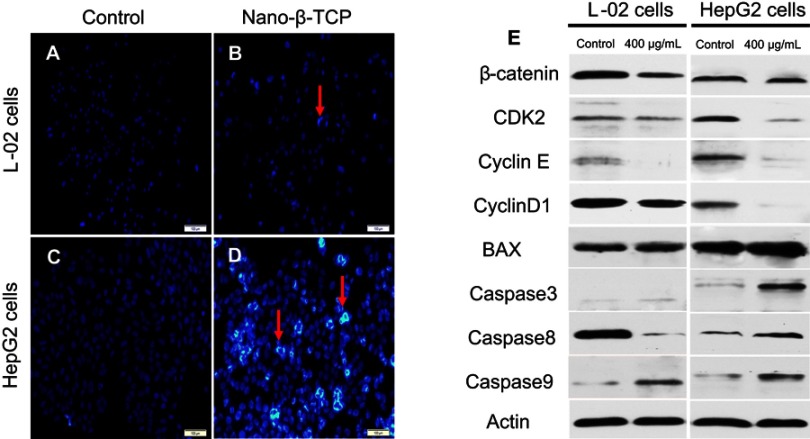
Figure 6.
(A–D) Fluorescent micrographs of cells before and after nano-β-TCP treatment for 48 hours. Cell nuclei were stained with Hochest33342. Apoptotic cells are labeled by red arrows. (E) Expression of some related cyclins (CyclinD1, CDK2, CyclinE, β-catenin) and apoptosis indexes (BAX, Caspase3, Caspase8, and Caspase9) in L-02 and HepG2 cells treated with nano-β-TCP for 48 hours. (Scale bar: 100 μm. Compared to the control group).

