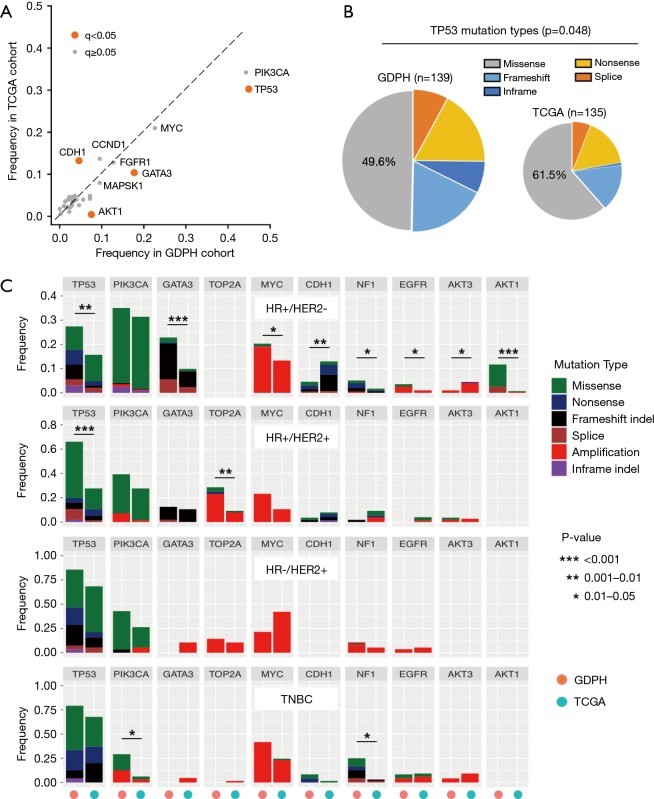
Figure 2.
Comparison of mutational spectrum between Chinese and TCGA cohorts. (A) The frequency of gene alterations in GDPH and TCGA cohorts. Astringent false discovery rate (FDR; q-value) <0.05 was used, and genes in which mutations showed a significant difference in frequency between the two cohorts are labels as an orange color. (B) The composition of TP53 mutation types in GDPH and TCGA cohorts is shown, and the proportion of missense mutation is compared between the two cohorts using the Chi-square test. (C) Differences in mutation frequencies between Chinese and Caucasians (obtained from TCGA). Mutations occurring in more than 10% of patients in at least one subgroup were selected. For each gene, the left bar represents data obtained from our cohort; right bar represents TCGA data. Fisher’s exact test was used to assess differences in mutation frequencies between the two cohorts. A P value less than 0.05 and odds ratio greater than 2 or odds ratio less than 0.5 were listed. Stars (*) denote statistically significant difference between the two cohorts.

