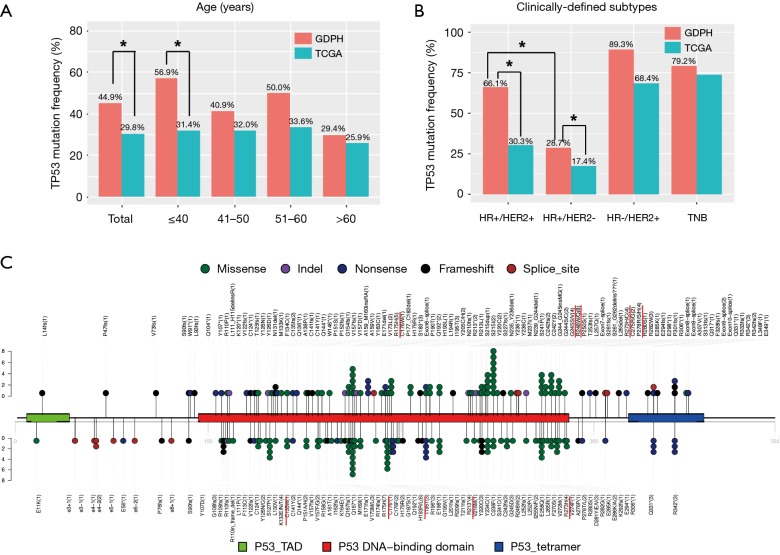
Figure 3.
The spectrum of TP53 mutation in Chinese breast cancer patients. The distribution of TP53 mutations is grouped by the age of breast cancer onset (A) and clinically-defined subgroups (B). The mutation frequencies for TP53 in GDPH and TCGA cohorts are compared using Fisher’s exact test. Stars (*) denote statistically significant difference (P<0.05). (C) Lollipop diagram depicts the type and location of TP53 mutation in our cohort (top) and TCGA cohort (bottom). Different types of mutations were colored by different colored dots, and each colored dots represents one TP53 mutation. The number of patients with a specific mutation was also listed in the parenthesis.

