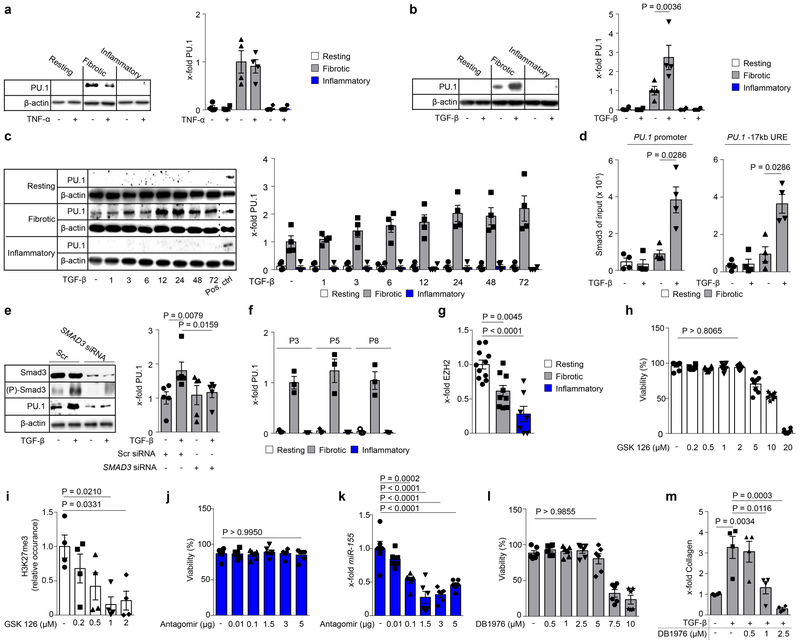
Extended Data Figure 4: Regulation of PU.1 expression in fibroblasts.
(a-c) PU.1 expression levels of primary human fibroblasts. Representative Western Blot and semi-quantitative analysis of PU.1 protein expression in resting (isolated from normal skin), fibrotic (isolated from fibrotic skin of SSc patients) and inflammatory (isolated from inflamed joints of RA patients) fibroblasts stimulated (a) with/without TNF-α for 24 hours, (b) with/without TGF-β for 24 hours or (c) for up to 72 hours (n = 4 each). Protein extracts of fibrotic fibroblasts were used as positive control in each lane. (d) ChIP analysis (n = 4 each) assessing binding of Smad3 to PU.1 promoter and its −17 kb upstream regulatory element (URE) is shown. (e) siRNA mediated knockdown of SMAD3 in fibrotic fibroblasts stimulated with/without TGF-β for 24 hours (n = 5). Scrambled (scr) siRNA was used as control. (f) Expression levels of PU.1 protein in primary human resting, fibrotic and inflammatory fibroblasts (n = 3 each) cultured ex vivo for several passages. (g) Expression levels of the enhancer of zeste homolog 2 (EZH2) in resting (n = 11), fibrotic (n = 9) and inflammatory fibroblasts (n = 7) relative to β-actin as assessed by Western blot analysis; results are presented relative to resting fibroblasts. (h, i) Resting fibroblasts treated with different concentrations of GSK126 as indicated (n = 3 each); (h) cell viability of fibroblasts was determined by CCK-8 toxicity assay. (i) Expression levels of H3K27me3 relative to total H3 as assessed by Western blot analysis; results are presented relative to untreated control. (j, k) Inflammatory fibroblasts treated with different concentrations of miR-155 antagomirs as indicated (n = 3 each) to investigate (j) cell viability by CCK-8 toxicity assay; (k) miR-155 expression levels relative to let-7b as assessed by qPCR; results are presented relative to cells co-transfected with scrambled antagomirs. (l, m) Fibrotic fibroblasts treated with different concentrations of DB1976 to analyze (l) cell viability by CCK-8 toxicity assay (n = 6); (m) DB1976 dose dependent effects upon TGF-β-induced collagen production (n = 4 each); results are presented relative to untreated control. Data are shown as the mean ± s.e.m. of respective n independent experiments. P values were determined by one-way ANOVA with Tukey's multiple comparison post hoc test.

