
Figure S2. AAS-dependent induction of autophagic flux in ARPE-19.
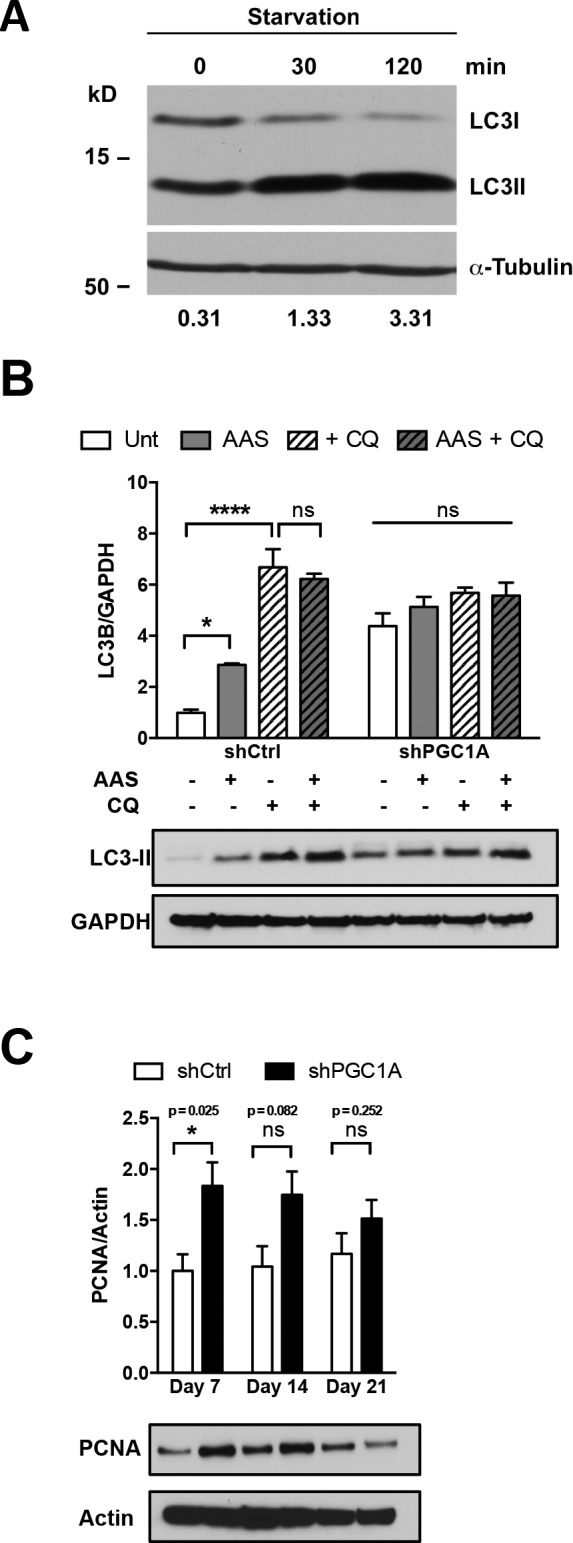
(A) Quantification of LC3I to LC3II protein conversion after AAS for 30 and 120 min in parental ARPE-19. Densitometric analysis of LC3II/LC3I ratios shows robust conversion (≈10-folds) at 2 h of treatment. (B) Densitometric analysis of LC3-II protein levels relative to GAPDH by Western blotting after AAS and/or CQ treatment in shCtrl and shPGC1A cells. Treatment of shPGC1A cells with CQ shows no increased accumulation of LC3II compared with shCtrl. Error bars represent mean ± SEM. Two-way ANOVA with Tukey’s post hoc test (n = 4). ***P ≤ 0.001; ****P ≤ 0.0001. (C) Densitometric analysis of PCNA protein levels relative to Actin by Western blotting in shCtrl and shPGC-1α ARPE-19 cells collected at 7, 14, and 21 d (n = 4). Error bars represent mean ± SEM. Data were analyzed by multiple unpaired t-test comparisons using the Holm–Sidak method. *P ≤ 0.05 compared with their respective shCtrl at each time point.