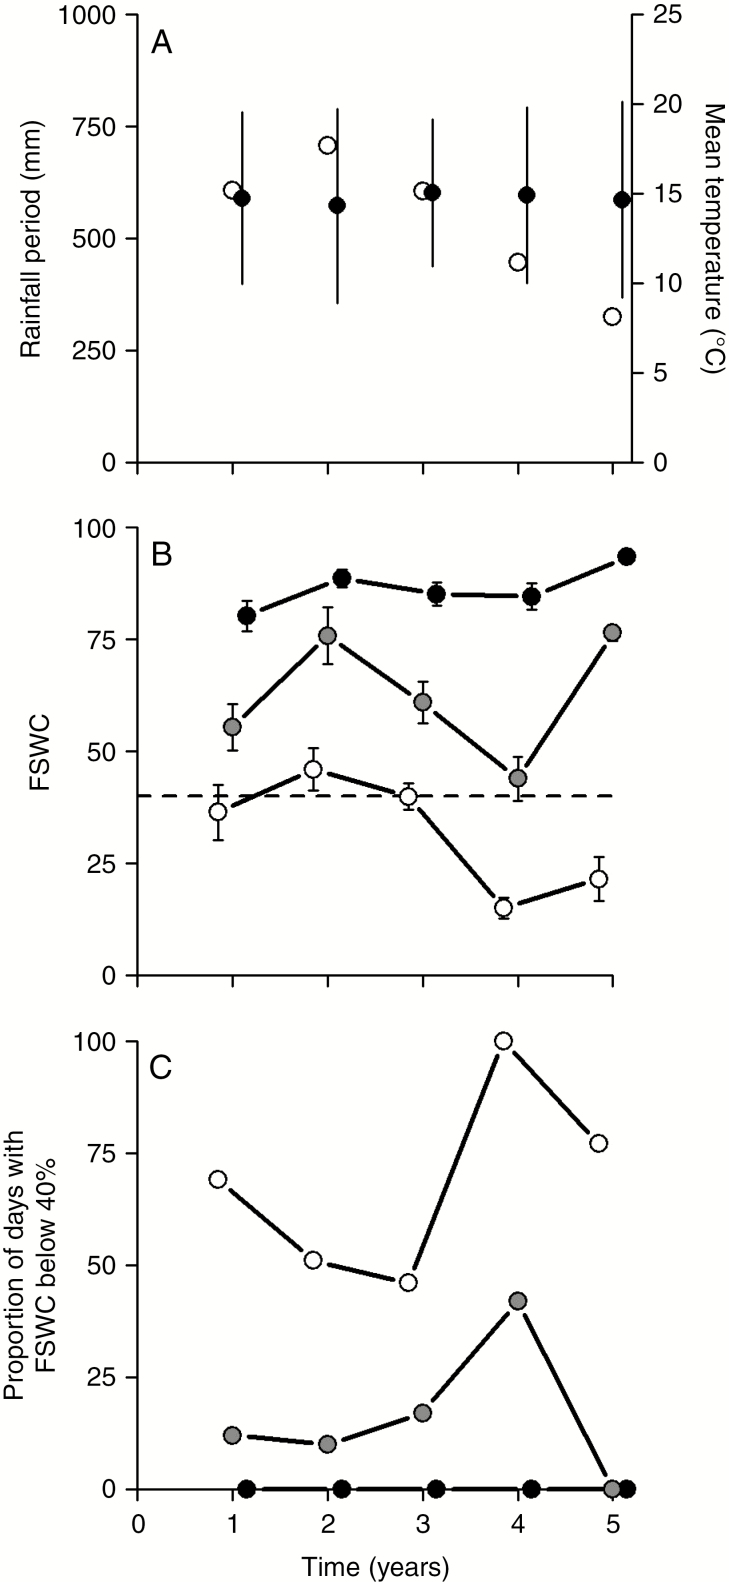
Fig. 1.
Climatic data. (A) Rainfall during the measurement periods (March to October) and mean annual temperature (values are mean ± standard deviation) from the ‘climatik’ database (Lusignan INRA station). (B) Fraction of soil water content (FSWC) averaged during regrowth each year. Black points represent the values of useful reserve for the first cut, grey points the second cut and white points the third cut. The dashed line represents a threshold of 40 %, below which grassland species are considered to be under water stress (FAO estimate of threshold values for grasslands). Values are mean ± confidence interval. (C) Proportion of days during regrowth when the FSWC index was <40 % for each year. Black points represent the value of FSWC for the first cut, grey points the second cut and white points the third cut.

