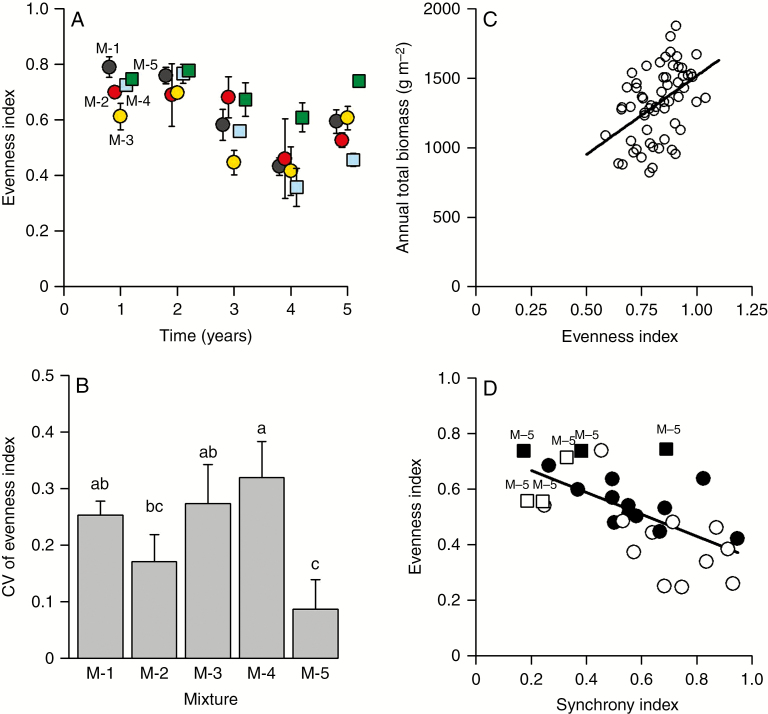
Fig. 4.
Equilibrium and synchrony level of species. (A) Equilibrium species abundances estimated from yearly evenness index for the five mixtures: M-1 (black points), M-2 (red points), M-3 (yellow points), M-4 (blue squares) and M-5 (green squares). (B) Inter-annual CV of the evenness index. Values are mean ± standard error. Different letters indicate significant differences (P < 0.05). (C) Annual total biomass as a function of evenness index for the 5 years of the experiment with the drought effect removed; residuals of models with the number of days when the fraction of soil water content (FSWC) index was <40 % as fixed factor. The regression through both sets of points is significant (P < 0.001), with R2 = 0.20. (D) Synchrony index as a function of evenness index for the fourth year (white points) and fifth year (black points). Square points correspond to mixture M-5 and round points correspond to the other mixtures. The regression through both sets of points is significant (P < 0.001), with R2 = 0.38.

