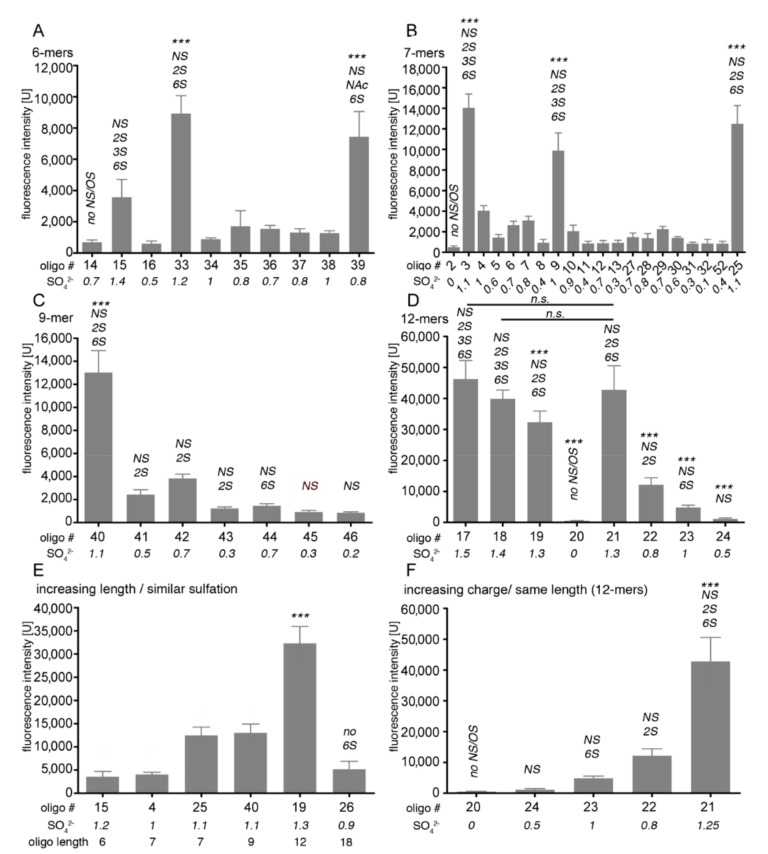
Figure 5.
HS microarray analysis of Shh binding. A total of 53 HS oligosaccharides were printed on microarray chips (36 dots/oligosaccharide) and incubated with soluble Shh. Shh binding is expressed as a histogram of relative fluorescence intensity. The numbered oligosaccharide sequences and structures for each sample are listed in the Supplementary Materials section; numbers in italics denote the average degree of sulfation per monosaccharide. (A) When 6-mers were compared, Shh binding to highly sulfated samples #33 and #39 was increased over that of all other samples (p < 0.001, n = 36). (B) Shh binding to 7-mers was also sulfation-dependent: Shh binding to samples #3, #9, and #25 was significantly increased over all other forms (p < 0.001, n = 36). (C) Sulfation-dependent Shh binding to oligosaccharides composed of 9 monosaccharides. Note that overall sulfation, but not any specific type of sulfation, is required for strong Shh binding (p < 0.001 when #40 is compared with all other samples, n = 36). (D) Sulfation-dependent Shh binding to oligosaccharides composed of 12 monosaccharides. All oligosaccharides differ significantly from each other in their Shh binding capacities (p < 0.001, n = 36), with the exception of samples #18 and #21 (n.s., p > 0.05) and #17 and #21 (p < 0.01, n = 36). (E) If oligosaccharides of different lengths but similar overall degrees of sulfation are compared, Shh binding to 12-mers is significantly increased over that of shorter forms. Longer oligosaccharides with reduced sulfation are less effective in Shh binding (compare #19 with #26). (F) If oligosaccharides of the same lengths but different overall degrees of sulfation are compared, Shh binding to highly sulfated probe #21 is preferred (p < 0.001, n = 36). Statistical significance was calculated by one-way ANOVA and Bonferroni’s multiple comparison test.

