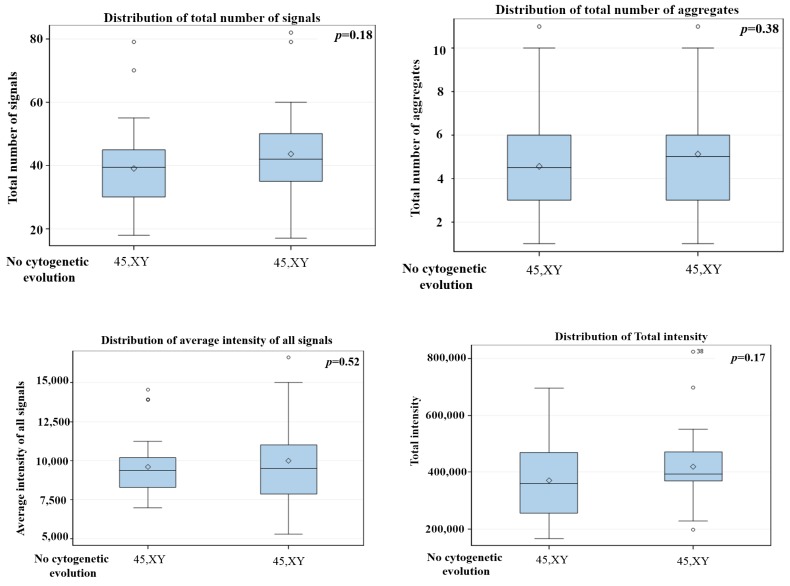
Figure 5.
3D telomere profiling during disease course in MDS without cytogenetic changes—two time points are shown after comparison of total number of signals, total number of aggregates, average intensity of signals and total intensity. The p values are in each graph, total number of aggregates, average intensity of signal and total intensity. p-values included in each graph indicate the significance when comparing the first with the last sample. (first time point with last time point collected). p-values for all other comparisons are shown in Supplementary Table S2. Patient number 9 (P9).

