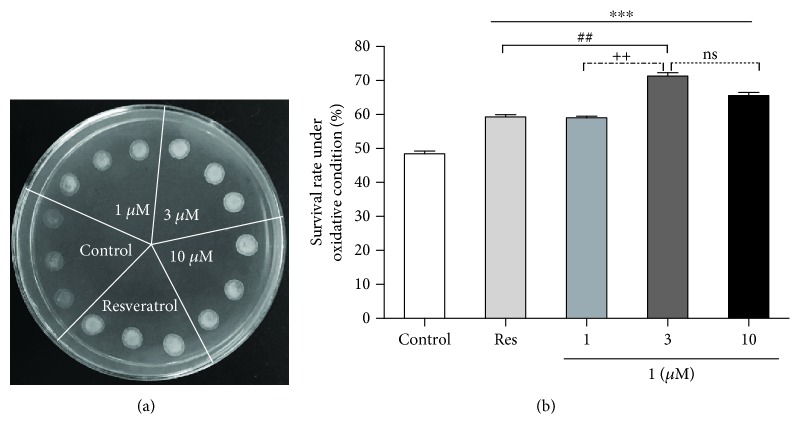
Figure 4.
Effects of 1 on the oxidative resistance of yeast. (a) BY4741 yeast with the control and 1-treated group were dropped in the same YPGlucose agar plate mixed with 9 mM H2O2. After 4 days, the growth of yeast cells in different groups was photographed. (b) Effect of 1 on the survival rates of yeast under oxidative stress condition when treated with 1, 3, and 10 μM of 1 or 10 μM of Res. Each experiment was performed at least thrice. ∗∗∗ indicates a significant difference between control and other groups (P < 0.001). ## represents a significant difference between Res and 3 μM group of 1 (P < 0.01). ++ represents a significant difference between 1 and 3 μM groups of 1 (P < 0.01). ns indicates no significant difference.

