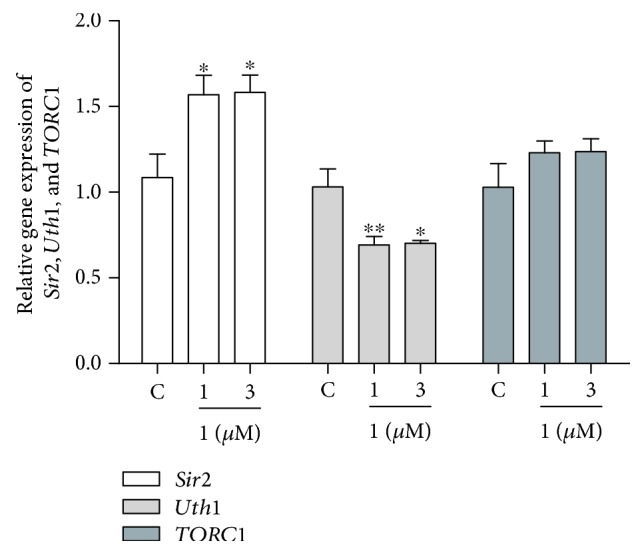
Figure 6.

Effects of 1 on the gene expression of Sir2, Uth1, and TORC1 of yeast. The results were presented as mean ± SEM for three independent experiments. ∗ and ∗∗ indicate a significant difference between the control and treatment groups (P < 0.05 and P < 0.01).
