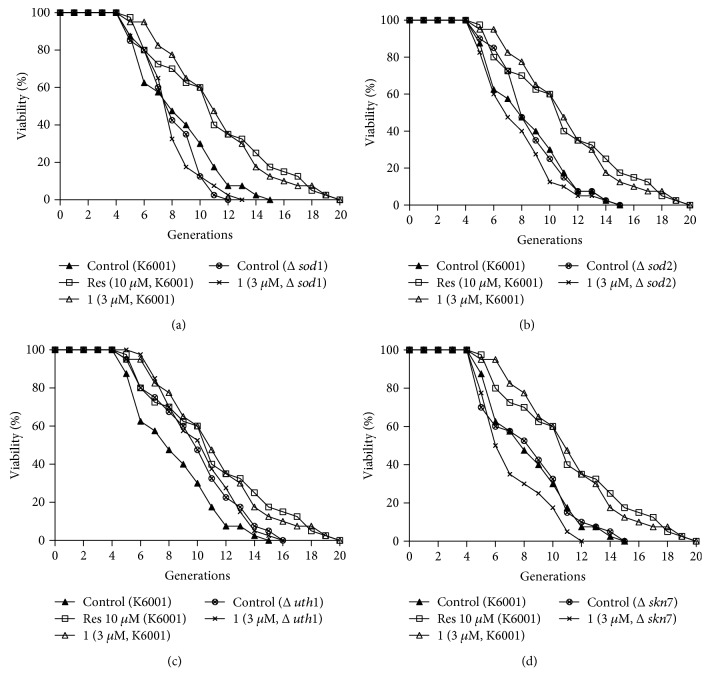
Figure 7.
Effect of 1 on the replicative lifespan of sod1 (a), sod2 (b), uth1 (c), and skn7 (d) mutants with a K6001 background. The average lifespan of K6001 in the control group was 7.55 ± 0.44, resveratrol at 10 μM was 10.28±0.67∗∗, and 1 at 3 μM was 10.28±0.60∗∗. (a) The average lifespan of Δsod1 in the control group was 7.18 ± 0.32 and 1 at 3 μM was 7.05 ± 0.31. (b) The average lifespan of Δsod2 in the control group was 7.82 ± 0.38 and 1 at 3 μM was 6.90 ± 0.40. (c) The average lifespan of Δuth1 in the control group was 9.10 ± 0.49 and 1 at 3 μM was 10.13 ± 0.49. (d) The average lifespan of Δskn7 in the control group was 7.53 ± 0.50 and 1 at 3 μM was 6.40 ± 0.36. ∗∗ indicates a significant difference relative to the corresponding control (P < 0.01).

