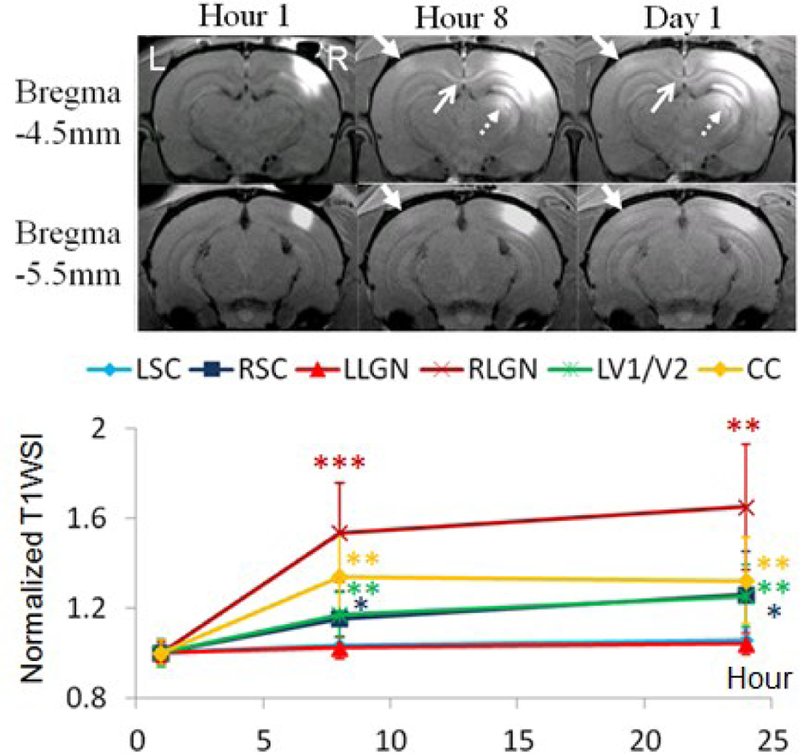
Fig. 3. Intracortical, single-dose Mn2+ injection.

(Top) MEMRI at 1, 8 and 24 hours after Mn2+ administration to the right V1/V2 transition zone. (Bottom) Quantitative analyses of T1W SI of visual components normalized to Hour 1. (Two-tailed paired t-tests with Hour 1, *p<0.05; **p<0.01; ***p<0.001)
