Figure 4.
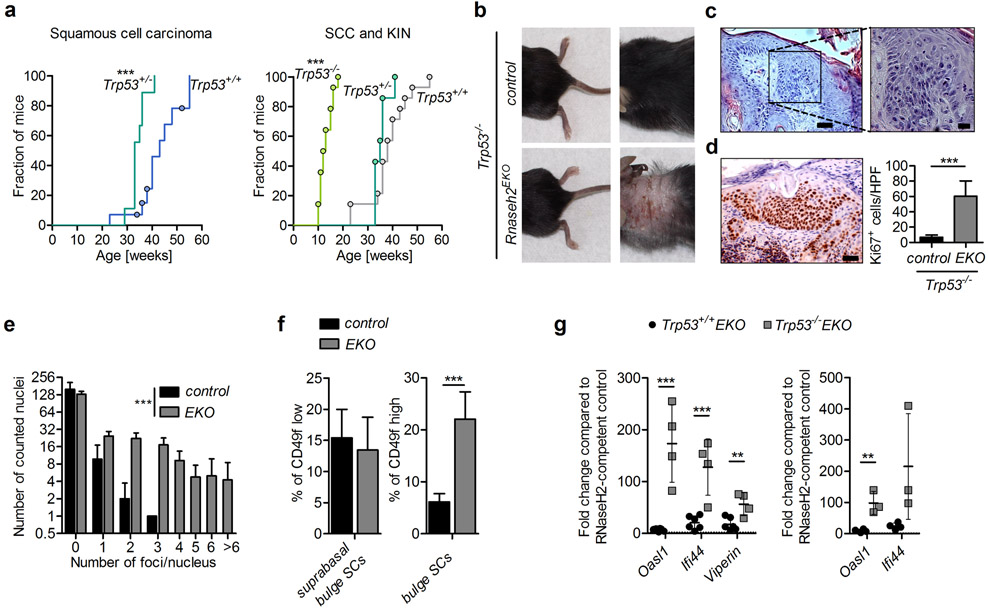
Additional loss of p53 in Rnaseh2EKO mice enhances the epidermal IFN response and accelerates hyperproliferation and cancerogenesis.
a) Incidence of invasive SCC (left) and of cancer of all stages (KIN and/or SCC, right) in Rnaseh2EKO mice that were Trp53WT/− or Trp53−/−. Cancer incidence of Trp53WT/WT Rnaseh2EKO mice from Fig.3e shown in light grey for comparison. ***p<0.0001 both (log-rank test).
b) Macroscopic phenotype of a 10 week-old Trp53−/−Rnaseh2EKO mouse and an 11 week-old control (Trp53−/−Rnaseh2bFL/FLCre-negative). Note normal pigmentation (tail and paws) of the mutant, in contrast to Trp53wtwtRnaseh2EKO mice (Fig.1a). Except for an inflamed, hyperkeratotic lesion in the neck with circumscribed hair loss, the fur is largely normal.
c) Representative H&E-stained neck skin section of a Trp53−/−Rnaseh2EKO mouse sacrificed for severe itching and erosions. Note typical features of KIN, including massive thickening of epidermis and severe dysplasia of the epithelium (irregular nuclear shape, numerous mitotic figures also in upper strata). See supplementary material for detailed histopathological findings. Scale bar left panel 50 µm, inset 20 µm.
d) Immunostaining of neck skin sections of 10–12 week-old Trp53−/−Rnaseh2EKO mice (n=4) and control (Trp53−/−Rnaseh2bFL/FLCre-negative) littermates (n=8) for Ki67. Representative image of Trp53−/−Rnaseh2EKO skin. Scale bar 50 µm. Graph shows numbers of Ki67+ epidermal cells per randomly placed high power (40x) field. Mean and SD, ***p<0.0001.
e) Quantification of γH2AX repair foci in immunostainded back skin of 10–13 week-old p53−/−Rnaseh2EKO (EKO) mice (n=4) and control (Trp53−/−Rnaseh2bFL/FLCre-negative) littermates (n=4). Number of foci was counted in at least 220 nuclei (interfollicular epidermis and follicles) per animal. See Fig.S4b for images. Mean and SD, ***p<0.0001 (one-way ANOVA).
f) Flow cytometric quantification of epithelial stem cell populations in back skin of 10–12 week-old Trp53−/−Rnaseh2EKO mice (n=6) and control (Trp53−/−Rnaseh2bFL/FLCre-negative) littermates (n=5). See Fig.S1f for gating; mean and SD, ***p=0.0001.
g) Comparison of ISG transcript levels determined by qRT-PCR in RNA extracted from total epidermis (left) or FACS-purified keratinocytes (right) of 10–12 week-old Trp53+/+Rnaseh2EKO and Trp53−/−Rnaseh2EKO mice to the mean obtained for the respective control group, which was set to 1. left: ***p=0.0005 (Oasl1), ***p<0.0001 (Ifi44), **p=0.0066 (Viperin), right: **p=0.0042 (Oasl1). (p53 deficiency alone did not cause a spontaneous IFN response, see Fig.S4d.)

