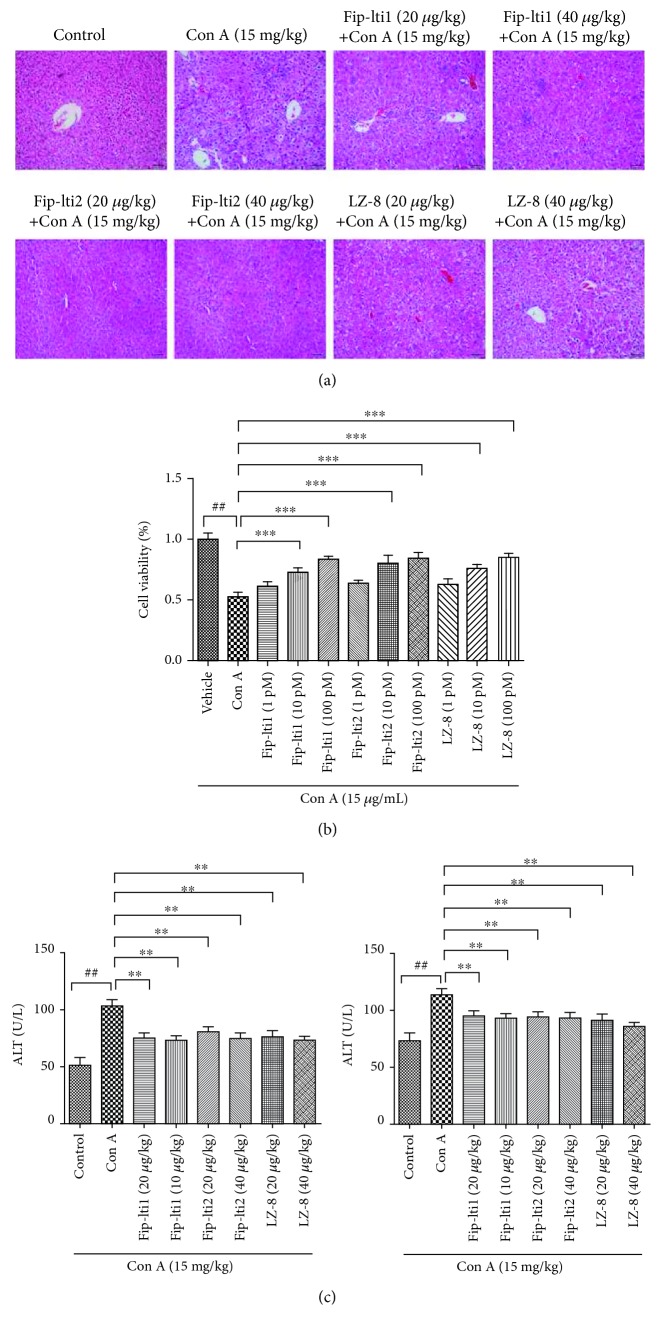
Figure 2.
Protection of Con A-induced liver injury by Fip-lti1 and Fip-lti2. (a) Liver histology of different groups and sections was stained by H&E. (b) Differences in L02 cell viability among different groups. (c) Serum AST and ALT levels among different groups. Each experiment was repeated at least three times and a representative one is shown. ## and ∗∗ indicate P < 0.01; ### and ∗∗∗ indicate P < 0.001.

