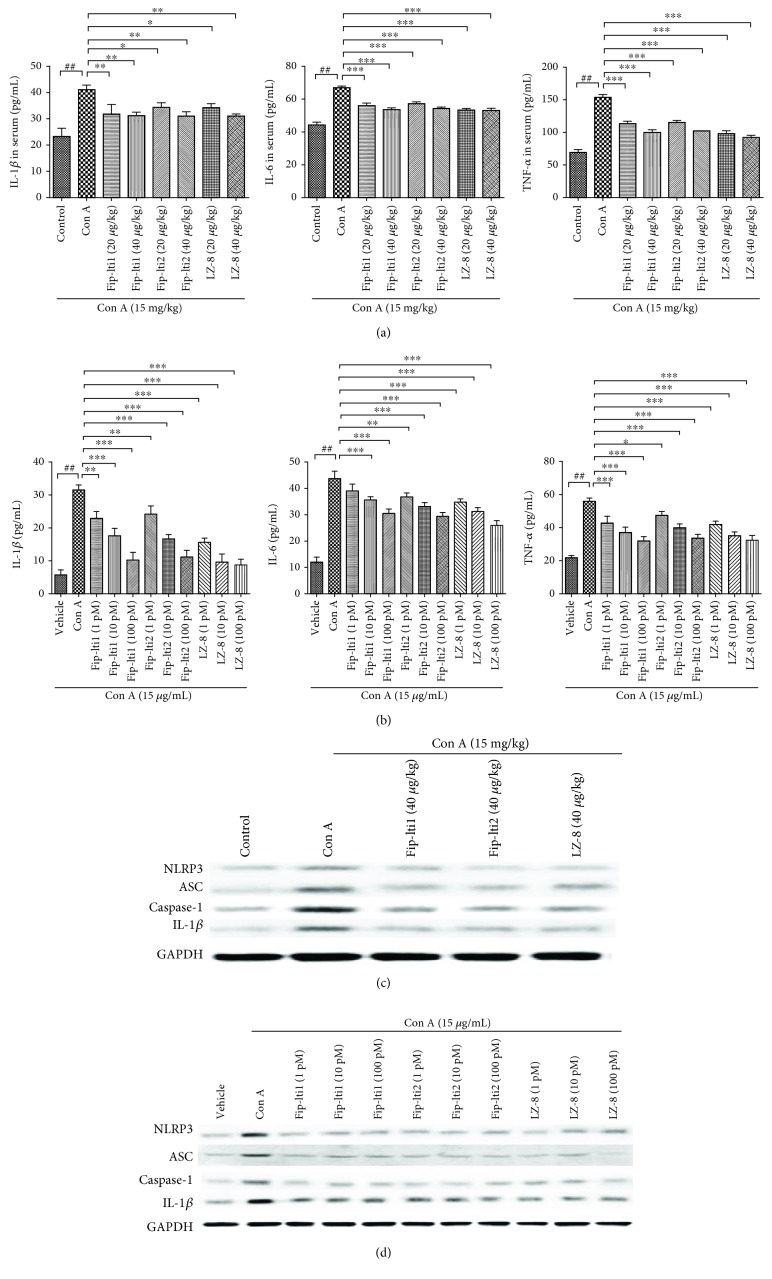
Figure 5.
Levels of proinflammatory cytokines were lower with the treatment with Fip-lti1 or Fip-lti2. (a) Serum IL-1β, IL-6, and TNF-α levels. (b) IL-1β, IL-6, and TNF-α levels in L02 medium. (c, d) Inflammation-associated protein expression levels in the livers and in L02 cells. Each experiment was repeated at least three times and a representative one is shown. ∗ indicates P < 0.05, ∗∗ indicates P < 0.01, and ### and ∗∗∗ indicate P < 0.001.

