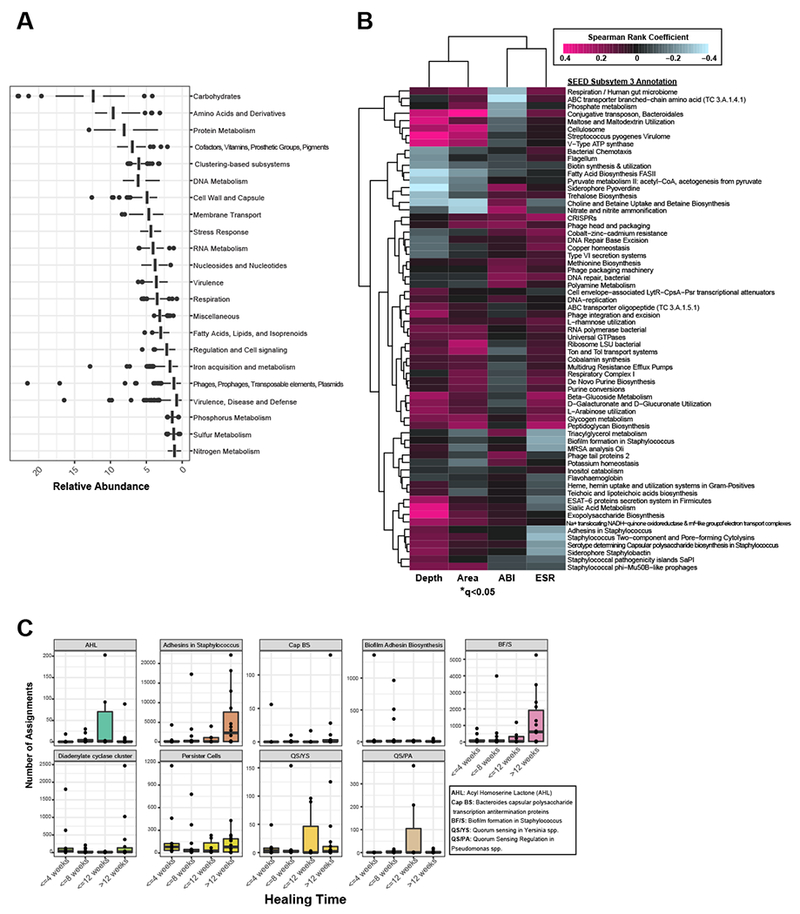
Figure 5: Metagenome annotation reveals functional subsystems associated with clinical factors and outcomes.

A) Mean relative abundance of the top SEED subsystem level 1 annotations detected in DFU metagenomes. B) Correlation heatmap and hierarchical clustering of SEED subsystem level 3 annotations with clinical co-variates. Color corresponds to Spearman rank coefficient (pink and blue indicating positive and negative correlation, respectively). Wound depth and area cluster separately from ankle brachial index (ABI) and eosinophil sedimentation rate (ESR), markers of inflammation. Asterisk indicates significant associations (q<0.05). C) Number of read assignments to SEED subsystem level 3 annotations, normalized by total read depth per sample, with biofilm-specific terms (y-axis). Samples are stratified by healing time (x-axis). Each plot represents a single term.
